
In our first article on this topic, Using Apache ECharts with React and TypeScript, we received a valuable insight from one of our readers.
They suggested looking into Use Apache ECharts with bundler and NPM in order to minimize your bundle size. Now, who doesn't want that!? We tried out the approach and integrated it with our ReactJS workflow.
Key take away was: Import only what you need and let the bundler do its job.
- Import the needed functions, charts, chart-components, etc.
import { CanvasRenderer } from "echarts/renderers";
import { init, getInstanceByDom, use } from "echarts/core";
import { HeatmapChart, ScatterChart, LineChart, GraphChart, BarChart } from "echarts/charts";
import {
  LegendComponent,
  GridComponent,
  TooltipComponent,
  ToolboxComponent,
  VisualMapComponent,
  TitleComponent,
  DataZoomComponent,
} from "echarts/components";
import type { ECharts, ComposeOption, SetOptionOpts } from "echarts/core";
- Import the corresponding (needed) types:
import type { ECharts, ComposeOption, SetOptionOpts } from "echarts/core";
import type {
  BarSeriesOption,
  LineSeriesOption,
  ScatterSeriesOption,
} from "echarts/charts";
import type { TitleComponentOption, GridComponentOption } from "echarts/components";
- Register the needed functions, charts, chart-components, etc.
// Register the required components
use([
  LegendComponent,
  ScatterChart,
  LineChart,
  BarChart,
  GridComponent,
  TooltipComponent,
  TitleComponent,
  ToolboxComponent, // A group of utility tools, which includes export, data view, dynamic type switching, data area zooming, and reset.
  DataZoomComponent, // Used in Line Graph Charts
  CanvasRenderer, // If you only need to use the canvas rendering mode, the bundle will not include the SVGRenderer module, which is not needed.
]);
- Combine the corresponding types.
// Combine an Option type with only required components and charts via ComposeOption
export type EChartsOption = ComposeOption<
  | BarSeriesOption
  | LineSeriesOption
  | TitleComponentOption
  | GridComponentOption
  | ScatterSeriesOption
>;
Here's the complete piece of code:
import { useRef, useEffect } from "react";
import { CanvasRenderer } from "echarts/renderers";
import { init, getInstanceByDom, use } from "echarts/core";
import { HeatmapChart, ScatterChart, LineChart, GraphChart, BarChart } from "echarts/charts";
import {
  LegendComponent,
  GridComponent,
  TooltipComponent,
  ToolboxComponent,
  VisualMapComponent,
  TitleComponent,
  DataZoomComponent,
} from "echarts/components";
import type { ECharts, ComposeOption, SetOptionOpts } from "echarts/core";
import type {
  BarSeriesOption,
  LineSeriesOption,
  ScatterSeriesOption,
} from "echarts/charts";
import type { TitleComponentOption, GridComponentOption } from "echarts/components";

// Register the required components
use([
  LegendComponent,
  ScatterChart,
  LineChart,
  BarChart,
  GridComponent,
  TooltipComponent,
  TitleComponent,
  ToolboxComponent, // A group of utility tools, which includes export, data view, dynamic type switching, data area zooming, and reset.
  DataZoomComponent, // Used in Line Graph Charts
  CanvasRenderer, // If you only need to use the canvas rendering mode, the bundle will not include the SVGRenderer module, which is not needed.
]);

// Combine an Option type with only required components and charts via ComposeOption
export type EChartsOption = ComposeOption<
  | BarSeriesOption
  | LineSeriesOption
  | TitleComponentOption
  | GridComponentOption
  | ScatterSeriesOption
>;

export interface ReactEChartsProps {
  option: EChartsOption;
  style?: CSSProperties;
  settings?: SetOptionOpts;
  loading?: boolean;
  theme?: "light" | "dark";
}

export function ReactECharts({
  option,
  style,
  settings,
  loading,
  theme,
}: ReactEChartsProps): JSX.Element {
  const chartRef = useRef<HTMLDivElement>(null);

  useEffect(() => {
    // Initialize chart
    let chart: ECharts | undefined;
    if (chartRef.current !== null) {
      chart = init(chartRef.current, theme);
    }

    // Add chart resize listener
    // ResizeObserver is leading to a bit janky UX
    function resizeChart() {
      chart?.resize();
    }
    window.addEventListener("resize", resizeChart);

    // Return cleanup function
    return () => {
      chart?.dispose();
      window.removeEventListener("resize", resizeChart);
    };
  }, [theme]);

  useEffect(() => {
    // Update chart
    if (chartRef.current !== null) {
      const chart = getInstanceByDom(chartRef.current);
      chart?.setOption(option, settings);
    }
  }, [option, settings, theme]); // Whenever theme changes we need to add option and setting due to it being deleted in cleanup function

  useEffect(() => {
    // Update chart
    if (chartRef.current !== null) {
      const chart = getInstanceByDom(chartRef.current);
      // eslint-disable-next-line @typescript-eslint/no-unused-expressions
      loading === true ? chart?.showLoading() : chart?.hideLoading();
    }
  }, [loading, theme]);

  return <div ref={chartRef} style={{ width: "100%", height: "100px", ...style }} />;
}
Parting Comments
The approach is worth trying out to check for any significant reductions in your bundle size; the small increase in your SLOC may eventually be well justified by a large decrease in your bundle size. In 1 particular scenario, we shaved off
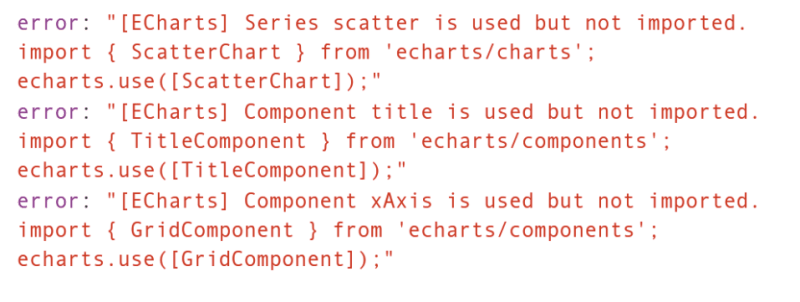
4 MBfrom our bundle but depending upon your use case, YMMW.One question may pop in our minds: "how do we know exactly what to import?". One thing you can try is simply observing your console logs. ECharts may throw useful warnings in case something critical is missing. Something like this:
Cheers! 👩💻👨💻


Latest comments (1)
Hey there. Great article, but one question though: When I implemented this setup, I lost animation effects. Is there a core component that I need to import and use to make animations work again?