In real-time angular applications, we often interact with some API or service to get data. These data can either be statistical or user-related. If you are building an application to show statistics about a country, you may use some third party APIs or services to get the data from. And this data can be shown either in tabular form or graphs. Graphs, also called as charts, are graphical representation of data to ease the understanding & analysing it. For example, if you are observing real-time stats of the weather across cities in chart, you can warn people about any adverse condition in weather and guide them to safer region as soon as possible. In this article, I will guide on how to fetch data from API in Angular and display it in chart so that we can understand and interpret the data in a better way.
Modules and Component Used for Application
Angular provides HTTPClient module for handling API and simple methods to handle the data. I will be using get method of HTTPClient along with subscribe method to fetch data from API. To display the data in the form of chart, I will be using CanvasJS angular chart component. CanvasJS provides simple API for customization look and feel of chart along with various other features like zooming/panning, exporting the chart in image format, updating the data dynamically, etc.
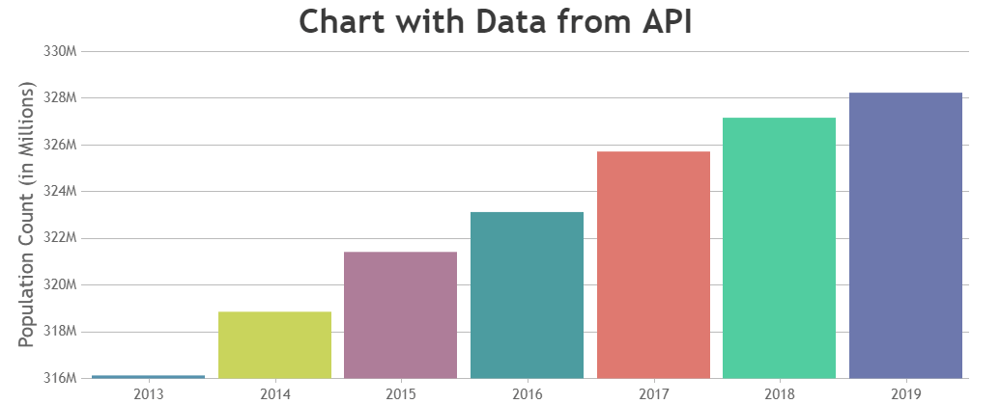
Note: API used in this article is from datausa.io which gives information about population of Unites States of America for the 2013-2019 period.
Prerequisites
Step by Step Instructions
1. Register HTTPClient modules & chart component in app.module.ts
import { HttpClientModule } from '@angular/common/http';

import { AppComponent } from './app.component';
import * as CanvasJSAngularChart from './assets/canvasjs.angular.component';
var CanvasJSChart = CanvasJSAngularChart.CanvasJSChart;

@NgModule({
    imports: [BrowserModule, HttpClientModule],
    declarations: [AppComponent, CanvasJSChart],
    bootstrap: [AppComponent],
})
export class AppModule {}
2. After registering the modules, import HttpClient in app.component.ts & create options for the chart.
/*app.component.ts*/
import { HttpClient } from '@angular/common/http';
.
export class AppComponent {
    chart: any;
    constructor(private http: HttpClient) {}

    chartOptions = {
    animationEnabled: true,
    theme: 'light2',
    title: {
        text: 'Chart with Data from API',
    },
    data: [
        {
        dataPoints: [],
        },
    ],
    };
    getChartInstance(chart: object) {
    this.chart = chart;
    }
}
3. Update the template html file (app.component.html) to add chart
/*app.component.html*/
<canvasjs-chart [options]="chartOptions" (chartInstance)="getChartInstance($event)"[styles]="{ width: '100%',
height: '360px' }"></canvasjs-chart>
4. Since there are no data to represent in the chart initially, let's initialize dataPoints variable to an empty array. Later we can update it with the data that we get from the API.
export class AppComponent {
  dataPoints: any = [];
  .
  chartOptions = {
  .
  .
  dataPoints: this.dataPoints
  .
  .
  }
}
5. Let's fetch the data from the API using get method. Set responseType to JSON as the API returns data in JSON format.
this.http.get('https://datausa.io/api/data?drilldowns=Nation&measures=Population',{ responseType: 'json'}).subscribe((response: any) => {
});
6. Before passing the data that we receive from the API request, we need to parse it to the format accepted by CanvasJS {label: String, y: Number}
responseData.data.forEach((populationData: any) => {
    this.dataPoints.push({
      label: populationData.Year,
      y: populationData.Population,
    });
  });
this.chart.render();
Viola!! We have fetched the data from API using HTTPClient module and represented the data in Chart.
Customizations
CanvasJS angular charts component comes with lots of customization options to make visualization better & fit with our website template / theme / use-case. For e.g., the API returns data in reverse sequence i.e. 2019 to 2013. In this case, you can reverse the x-axis so that the axis is shown from 2013 to 2019. To make axis labels look easier to read, you can add number suffix with the help of labelFormatter. Below is the code-snippet which doesn’t the same. You can refer to this page for more customization options available in the library.
axisX: {
    reversed: true
},
axisY: {
    title: 'Population Count (in Millions)',
    labelFormatter: function (e: any) {
        return e.value / 1000000 + 'M';
    }
}
Enahancements
The same concept can further be enhanced to build the complete dashboard with data from JSON.


Oldest comments (0)