
Finding relationships within categorical data is graph's strong point. Doing so at scale, as Quine now makes possible, has significant implications for cyber security, fraud detection, observability, logistics, e-commerce, and any use case that graph is both well-suited for and which must process high velocity data in real time.
The goal of this test is to demonstrate a high-volume of sustained event ingest that is resilient to cluster node failure in both Quine and the persister using commodity infrastructure, and to share performance and cost results along with details of the test for those interested in either reproducing results or running Quine in production.

Our tests delivered the following results:
- 1M events/second processed for a 2 hour period
- 1M+ writes per second
- 1M 4-node graph traversals (reads) per second
- 21K results (4-node pattern matches) emitted per second
- 140 commodity hosts plus 1 hot spare running Quine Enterprise
- 66 storage hosts using Apache Cassandra persistor
- 3 hosts for Apache Kafka
Infrastructure
The Cassandra persistor layer’s settings are set at a TTL of 15 minutes and a replication factor of 1 to manage quota limits and spending on cloud infrastructure. This does not fit every possible use case, but it is fairly common. Other scenarios which are more data-storage oriented will often increase the replication factor and/or TTL. In those variations, maintaining the 1 million events/sec processing rate would require increasing the number of Cassandra hosts or disk storage, both of which are budgetary concerns more than technical concerns.
| Component | # of Hosts | Host Types |
|---|---|---|
| Quine Cluster | 141 |
|
| Cassandra Persistor Cluster | 66 |
|
| Kafka | 3 |
|
The Test
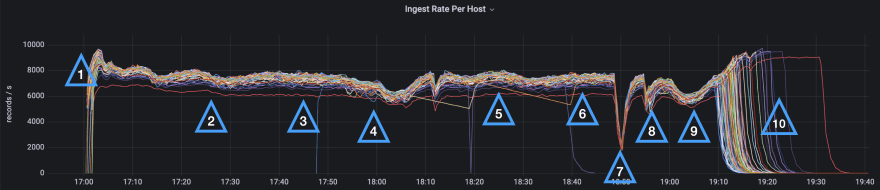
The plan is set out below, with each action labeled and the results explained. Events are clearly marked by sequence # on the Grafana screen grabs below the table.
A few notes on the test:
- A script is used to generate events
- Host failures are manually triggered.
- We used Grafana for the results (and screenshots).
- We pre-loaded Kafka with enough events to sustain one million events/second for two hours.
- A Cassandra cluster is used for persistent data storage. The Cassandra cluster is not over-provisioned to accommodate compaction intentionally (a common strategy) so that the effects of database maintenance on the ingest rate can be demonstrated.
- The cluster is run in a Kubernetes environment
| Seq # | Actions | Expected Results | Actual Results |
|---|---|---|---|
| 1 | Start the Quine cluster and begin ingest from Kafka | The ingest rate increase and settle at or above 1 million events per second | Observed |
| 2 | Let Quine run for 40 minutes to establish a stable baseline | Quine does not fail and maintains a baseline ingest rate at or above 1 million events per second. | Observed |
| 3 | Kill a Quine host | Quine ingest is not significantly impacted. The hot spare steps in to recover quickly, and Kubernetes replaces the killed host which becomes a new hot spare. | Observed at 17:47. No impact to ingest rate. The hot spare recovered quickly and ingest was not impacted. |
| 4 | Persistor Maintenance | Cassandra regularly performs maintenance, Quine experiences this as increased latency and should backpressure the ingest to maintain stability during database maintenance. | From 17:55 - 18:15 the ingest rate is reduced as a corresponding increase in latency is measured above 1ms across all nodes from the Cassandra persistor. |
| 5 | Kill two Quine hosts | Observe the following sequence: hot spare recovers one host, whole cluster suspends ingest due to being degraded, Kubernetes replaces killed hosts, first replaced host recovers the cluster, and the second replaced host becomes the new hot spare. | Observed from 18:18 - 18:25. Due to Kubernetes the impact was not visible. However, the expected sequence was confirmed in the logs. |
| 6 | Stop and resume a Quine host for about 1 minute to inject high latency | Quine detects the host is no longer available, boots it from the cluster, and hot spare steps in to recover. When the rejected host resumes, it learns it was removed from the cluster, so it shuts down, is restarted by Kubernetes, and to become the new hot spare | Observed from 18:41 - 18:46. No impact to ingest rate as the back pressured ingest was for a single host in the cluster, and the recovery happened quickly. |
| 7 | Stop and resume a Cassandra persistor host for about 1 minute to inject high latency | Quine back pressures ingest until Cassandra persistor has recovered | Observed from 18:47 - 18:54. Due to replication factor = 1, ingest was impacted until Cassandra persistor recovered. Then ingest resumed to > 1M e/s. |
| 8 | Kill a Cassandra persistor host | Quine suspends ingest until Cassandra persistor recovers with a new host | Observed from 18:54 - 19:10. The host was recovered quickly due to kubernetes, and ingest briefly recovered to 1M e/s by 18:58 (only a few minutes). |
| 9 | Persistor Maintenance | Cassandra regularly performs maintenance, Quine experiences this as increased latency and should backpressure the ingest to maintain stability during database maintenance. | From 17:55 - 18:15 the ingest rate is reduced as a corresponding increase in latency is measured above 1ms across all nodes from the Cassandra persistor. |
| 10 | Let Quine consume the remaining Kafka stream | Observe the Quine hosts drop to zero events per second (not all at once) | Observed from 19:10 - 19:35. Around the time Cassandra persistor latency was returning to 1ms, and ingest returned to 1M e/s, the pre-loaded ingest stream began to become exhausted on some hosts. For the following 20 minutes hosts exhausted their partitions in the stream. |
The Results

As you can see from the overall ingest rate results:
- #1 shows an initial peak of 1.25M events/sec
- #2 Quine settles into a steady ingest rate > 1 million events/sec
- #3 Quine recovers nicely after single node shutdown
- Quine settles into a steady ingest rate > 1 million events/sec
- #s 4 and 9 show Cassandra maintenance event (see Cassandra Latency - Figure 3)
- #5 Quine has no problem with two-node failure events.
We observed that a persistor node high-latency event (7) has a more marked impact on performance than either a Quine node failure (5) or an outright failure of a persistor node (8). In the case of a clear failure, Kubernetes is quick to replace the node, allowing ingest to resume. In cases when a persistence node state is non-responsive but not clearly down, Quine’s response is to back pressure ingest until the node is recovered.
An alternate variation on this test could use more persistor machines to stabilize ingest rates during maintenance events.
The individual Quine node ingest graphs indicate when individual nodes are offline and reinforces the observation that Quine Enterprise’s cluster resilience allows for smooth operation during high-volume ingest, even in the face of a Quine node shut down or failure. Quine’s overall performance, and hence an area of operational focus for anyone planning a production deployment, more closely conforms with persistor performance.

The median query latency for the Cassandra cluster during this test was <1 ms. Even during/following persistor shutdown (8) or node failure (7), cluster latency stayed < 1.5 ms. Events at (1), (5), and (8), all reflect increased latency for single nodes.
Standing Queries and 1 Million 4-node traversals per second
The purpose of running any complex event processor, Quine included, is in detecting and acting on high-value events in real time. This could mean detecting indications of a cyber attack, or video stream buffering, or identifying e-commerce upsell opportunities at check out. This is where Quine really excels.
Standing queries are a unique feature of Quine. They monitor streams for specified patterns, maintaining partial matches, and executing user-specified actions the instant a full match is made. Actions can include anything from updating the graph itself by creating new nodes or edges, writing results out to Kafka (or Kinesis, or posting results to a webhook).
In this test, Quine standing queries monitored for specific 4-node patterns requiring a 4-node traversal every time an event was ingested. Traditional graph databases slow down ingest when performing multi-node traversal. Not Quine. Quine’s ability to sustain high-speed data ingest together with simultaneous graph analysis is a revolutionary new capability. Not only did Quine ingest more than 1,000,000 events per second, it analyzed all that data in real-time to find more than 20,000 matches per second for complex graph patterns. This is a whole new world!
Why Quine Hitting 1 Million Events/Sec Matters
Since its release in 2007 at the start of the NoSQL revolution, Neo4J have proven conclusively the value of graph to connect and find complex patterns in categorical data.
The graph data model is indispensable to everything from fraud detection to network observability to cybersecurity. It is used for recommendation engines, logistics, and XDR/EDR.
But not long after NoSQL hit the scene, Kafka kicked off the movement toward real-time event processing. Soon, event processors like Flink, Spark Streaming and ksqlDB brought the ability to process live streams. These systems relied on less-expressive key-value stores or slower document and relational databases to save intermediate data.
Quine is the graph analog and is important because now you can do what graph is really good at -- finding complex patterns across multiple streams of data using not just numerical but categorical data.
Quine makes all the great graph use cases viable at high volumes and in real time.
What’s Next
If you want to reproduce this test, we have published the test details on Github so that you can understand and run it yourself..
If you want help planning your own test, or you would like to try the Quine Enterprise, please contact us. You can also read more about Quine Enterprise here.
Or you can start learning about Quine now by visiting the Quine open source project. We have a Slack channel where folks can ask questions and we are always up for a call.


Top comments (0)