
Get Out has been one of the most talked about films in 2017 and as of April 2017 the highest grossing debut film based on an original screenplay in history. We want to programmatically find out how Get Out ranked amongst other 2017 American films and which films have earned the most revenue in 2017. This tutorial assumes most readers have basic working knowledge of Python.
Prequisites
-
Install the following python packages and run them ideally in a virtualenv.
- config
- requests
- locale
- pandas
- matplotlib
-
In addition to installing the above dependencies we will need to request an API key from The Movie DB (TMDB). TMDB has a free API to programmatically access information about movies.
- In order to request an API key from TMDB:
- Create a free account
- Check your e-mail to verify your account.
- Visit the API Settings page in your Account Settings and request an API key
- You should now have an API key and be ready to go!
- In order to request an API key from TMDB:
import config # to hide TMDB API keys
import requests # to make TMDB API calls
import locale # to format currency as USD
locale.setlocale( locale.LC_ALL, '' )

import pandas as pd
import matplotlib
import matplotlib.pyplot as plt
from matplotlib.ticker import FuncFormatter # to format currency on charts axis

api_key = config.tmdb_api_key # get TMDB API key from config.py file
If you plan on committing your project to GitHub or another public repository and need help setting up config you should read this article about using config to hide API keys.
Part 1: Determine the highest earning American films of 2017
In this section we will request 2017 data from TMDB, store the data we recieve as a json into a dataframe and then use matplotlib to visualize our data.
Make API Call to TMDB to return the data of interest
In order to get the highest earning films from TMDB an API request needs to be constructed to return films with a primary_release_year of 2017 sorted in descending order by revenue.
response = requests.get('https://api.themoviedb.org/3/discover/movie?api_key=' + api_key + '&primary_release_year=2017&sort_by=revenue.desc')
highest_revenue = response.json() # store parsed json response

# uncomment the next line to get a peek at the highest_revenue json structure
# highest_revenue

highest_revenue_films = highest_revenue['results']
Create dataframe from JSON returned from TMDB API call
Let's store the JSON data returned from our API call in a dataframe to store each film and its associated revenue.
# define column names for our new dataframe
columns = ['film', 'revenue']

# create dataframe with film and revenue columns
df = pandas.DataFrame(columns=columns)
Now to add the data to our dataframe we will need to loop through the data.
# for each of the highest revenue films make an api call for that specific movie to return the budget and revenue
for film in highest_revenue_films:
    # print(film['title'])
    film_revenue = requests.get('https://api.themoviedb.org/3/movie/'+ str(film['id']) +'?api_key='+ api_key+'&language=en-US')
    film_revenue = film_revenue.json()
    #print(locale.currency(film_revenue['revenue'], grouping=True ))
    df.loc[len(df)]=[film['title'],film_revenue['revenue']] # store title and revenue in our dataframe
Below is what the dataframe head (top 5 lines) looks like after iterating through the films our API call returned.
df.head()
.dataframe thead tr:only-child th {
    text-align: right;
}

.dataframe thead th {
    text-align: left;
}

.dataframe tbody tr th {
    vertical-align: top;
}
| film | revenue | |
|---|---|---|
| 0 | Beauty and the Beast | 1221782049 |
| 1 | The Fate of the Furious | 1212583865 |
| 2 | Guardians of the Galaxy Vol. 2 | 744784722 |
| 3 | Logan | 608674100 |
| 4 | Kong: Skull Island | 565151307 |
Let's actually see the data with matplotlib
We will create a horizontal bar chart using matplotlib to display the revenue earned for each film.
matplotlib.style.use('ggplot')
fig, ax = plt.subplots()
df.plot(kind="barh", y='revenue', color = ['#624ea7', '#599ad3', '#f9a65a', '#9e66ab', 'purple'], x=df['film'], ax=ax)

#format xaxis in terms of currency
formatter = FuncFormatter(currency)
ax.xaxis.set_major_formatter(formatter)
ax.legend().set_visible(False)

avg = df['revenue'].mean()

# Add a line for the average
ax.axvline(x=avg, color='b', label='Average', linestyle='--', linewidth=1)

ax.set(title='American Films with Highest Revenue (2017)', xlabel='Revenue', ylabel='Film')
[<matplotlib.text.Text at 0x111f8aba8>,
 <matplotlib.text.Text at 0x111f20978>,
 <matplotlib.text.Text at 0x111fad2e8>]

Part 2: Determine the highest earning American films of all-time
In this section we will request all-time data from TMDB, store the data we recieve as a json into a dataframe and then use matplotlib to visualize our data. Our API call will be similar to the one we used in the previous section but sans &primary_release_year=2017.
Requesting, formatting and storing API data
response = requests.get('https://api.themoviedb.org/3/discover/movie?api_key=' +  api_key + '&sort_by=revenue.desc')
highest_revenue_ever = response.json()
highest_revenue_films_ever = highest_revenue_ever['results']

columns = ['film', 'revenue', 'budget', 'release_date']
highest_revenue_ever_df = pandas.DataFrame(columns=columns)

for film in highest_revenue_films_ever:
    # print(film['title'])

    film_revenue = requests.get('https://api.themoviedb.org/3/movie/'+ str(film['id']) +'?api_key='+ api_key+'&language=en-US')
    film_revenue = film_revenue.json()
    # print(film_revenue)

    # print(locale.currency(film_revenue['revenue'], grouping=True ))

    # Lord of the Rings duplicate w/ bad data was being returned  https://www.themoviedb.org/movie/454499-the-lord-of-the-rings
    # It's budget was $281 which is way too low for a top-earning film. Therefore in order to be added to dataframe the film
    # budget must be greater than $281.

    if film_revenue['budget'] > 281:
        # print(film_revenue['budget'])
        # add film title, revenue, budget and release date to the dataframe
        highest_revenue_ever_df.loc[len(highest_revenue_ever_df)]=[film['title'],film_revenue['revenue'], (film_revenue['budget'] * -1), film_revenue['release_date']]

highest_revenue_ever_df.head()
.dataframe thead tr:only-child th {
    text-align: right;
}

.dataframe thead th {
    text-align: left;
}

.dataframe tbody tr th {
    vertical-align: top;
}
| film | revenue | budget | release_date | |
|---|---|---|---|---|
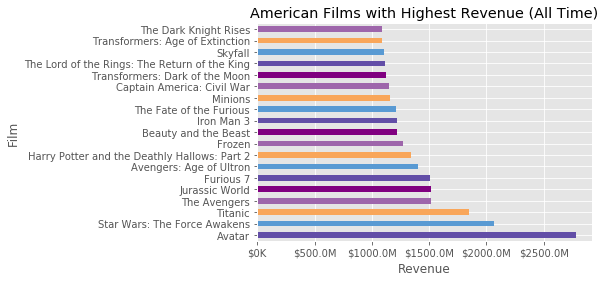
| 0 | Avatar | 2781505847 | -237000000 | 2009-12-10 |
| 1 | Star Wars: The Force Awakens | 2068223624 | -245000000 | 2015-12-15 |
| 2 | Titanic | 1845034188 | -200000000 | 1997-11-18 |
| 3 | The Avengers | 1519557910 | -220000000 | 2012-04-25 |
| 4 | Jurassic World | 1513528810 | -150000000 | 2015-06-09 |
Calculate the gross profit
We can calculate the gross profit by subtracting total revenue from amount spent. Earlier we made the budget values negative therefore we need to add the revenue to the (negative) budget to get the gross profit which is effectively subtraction.
highest_revenue_ever_df['gross'] = highest_revenue_ever_df['revenue'] + highest_revenue_ever_df['budget']
What does the dataframe look like now?
highest_revenue_ever_df.head()
.dataframe thead tr:only-child th {
    text-align: right;
}

.dataframe thead th {
    text-align: left;
}

.dataframe tbody tr th {
    vertical-align: top;
}
| film | revenue | budget | release_date | gross | |
|---|---|---|---|---|---|
| 0 | Avatar | 2781505847 | -237000000 | 2009-12-10 | 2544505847 |
| 1 | Star Wars: The Force Awakens | 2068223624 | -245000000 | 2015-12-15 | 1823223624 |
| 2 | Titanic | 1845034188 | -200000000 | 1997-11-18 | 1645034188 |
| 3 | The Avengers | 1519557910 | -220000000 | 2012-04-25 | 1299557910 |
| 4 | Jurassic World | 1513528810 | -150000000 | 2015-06-09 | 1363528810 |
Plotting data in matplotlib with horizontal bar charts and a scatter plot
fig, ax = plt.subplots()
highest_revenue_ever_df.plot(kind="barh", y='revenue', color = ['#624ea7', '#599ad3', '#f9a65a', '#9e66ab', 'purple'], x=highest_revenue_ever_df['film'], ax=ax)
formatter = FuncFormatter(currency)
ax.xaxis.set_major_formatter(formatter)
ax.legend().set_visible(False)
ax.set(title='American Films with Highest Revenue (All Time)', xlabel='Revenue', ylabel='Film')
[<matplotlib.text.Text at 0x111c90e48>,
 <matplotlib.text.Text at 0x111f85588>,
 <matplotlib.text.Text at 0x1120f0e48>]
fig, ax = plt.subplots()
highest_revenue_ever_df.plot(kind="barh", y='gross', color = ['#624ea7', '#599ad3', '#f9a65a', '#9e66ab', 'purple'], x=highest_revenue_ever_df['film'], ax=ax)
formatter = FuncFormatter(currency)
ax.xaxis.set_major_formatter(formatter)
ax.legend().set_visible(False)
ax.set(title='Gross Profit of the American Films with Highest Revenue (All Time)', xlabel='Gross Profit', ylabel='Film')
[<matplotlib.text.Text at 0x112285cf8>,
 <matplotlib.text.Text at 0x1120bf198>,
 <matplotlib.text.Text at 0x11234de10>]

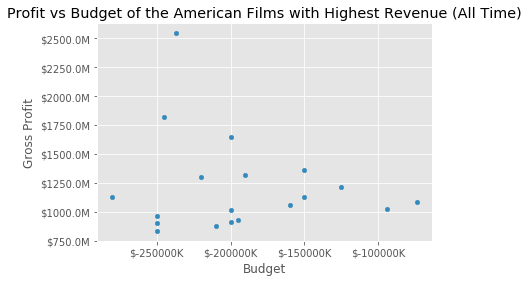
fig, ax = plt.subplots()
highest_revenue_ever_df.plot(kind='scatter', y='gross', x='budget', ax=ax)
formatter = FuncFormatter(currency)
ax.xaxis.set_major_formatter(formatter)
ax.yaxis.set_major_formatter(formatter)
ax.set(title='Profit vs Budget of the American Films with Highest Revenue (All Time)', xlabel='Budget', ylabel='Gross Profit')
[<matplotlib.text.Text at 0x112b67f98>,
 <matplotlib.text.Text at 0x112b29518>,
 <matplotlib.text.Text at 0x112b8e550>]
# Adding release year to dataframe
# highest_revenue_ever_df['year'] = pd.DatetimeIndex(highest_revenue_ever_df['release_date']).year
# print(highest_revenue_ever_df)
Limitations
The above data and graphs do not account for inflation (the TMDB API returns by revenue unadjusted by inflation) therefore the earnings from more recent films are more weighted than their earlier counterparts. When looking at all time data inflation should be adjusted for however when looking over a shorter time period adjusting for inflation might not be necessary. Older films would appear above if inflation was taken into account, as it is now, the oldest film on this list was The Titanic in 1997.
Lead photo is Chris Washington, played by Daniel Kaluuya, from Get Out. Universal Pictures
A version of this article was originally published by Monica Powell on www.datalogues.com


Top comments (3)
Hi @m0nica ,
Thanks for writing this tutorial. I am learning Python and your tutorial helps a lot!
Just a question on this bit of code please:
film_revenue = requests.get('api.themoviedb.org/3/movie/'+ str(film['id']) +'?api_key='+ api_key+'&language=en-US')
how did you know the format of the API link for revenue (the link inside requests.get)? Is there a specific documentation I can follow?
Thanks,
Marvin
I followed the documentation at developers.themoviedb.org/3/gettin.... I'd recommend starting there to get a better sense of what the TMDB API supports and how API requests should be formatted.
This is so great, and exactly what I was looking for to start playing with tmdb's api, thank you! I am a newbie, but I think I found one little error. You import pandas as pd, but later do df = pandas.DataFrame(columns=columns), which should be pd.DataFrame(columns=columns).
Thanks again!