Well, the last few weeks I had been working in the redesign of LOCALLY Engage which will be launched in the next few days! This feature was quite challenging and required me to use things I haven’t used for a long time! One of the things I had to do was plotting a map to display the Beacons and Geofences of a certain customer.
The scope was pretty simple in our case as Geofences were always polygons or circles, while the beacons were represented by markers.
As the proposal of this dashboard was make everything dynamic which means that all the data had to be pulled with AJAX requests. (We decided against moving to React at this time because the legacy system we inherited was already built using CakePHP's templating language) The map info also needed to pulled via AJAX and then displayed in the client side.
After building all the functions in the back end, my decision wouldn’t had been different than use Maps JavaScript API which is a very simple way to achieve this!
Let’s do some coding!
The Server response
Imagining that you have a JSON response like that for Beacons:
{
   "beacons":[
      {
         "lat":-37.829996,
         "lng":144.967707,
         "address":"65 Coventry Street, Southbank, Victoria 3006, Australia"
      },
      {
         "lat":-37.829857,
         "lng":144.967851,
         "address":"1021 / 65 Coventry street, Southbank, Victoria 3006, Australia"
      }
   ]
}
And a JSON response like that for Geofences:
{
  "geofences": [{
                "type": "POLYGON",
                "object": "POLYGON((-76.94644698125 38.74057911875,-76.33609541875 38.74057911875,-76.33609541875 39.35093068125,-76.94644698125 38.74057911875))",
                "description": "A nice Polygon!",
                "lat": 38.94403,
                "lng": -76.539546,
                "coordinates": [
                    {
                        "lat": 38.74057911875,
                        "lng": -76.94644698125
                    },
                    {
                        "lat": 38.74057911875,
                        "lng": -76.33609541875
                    },
                    {
                        "lat": 39.35093068125,
                        "lng": -76.33609541875
                    },
                    {
                        "lat": 38.74057911875,
                        "lng": -76.94644698125
                    }
                ]
            },
             {
                "type": "RADIUS",
                "object": "POINT(-83.4885590000 42.5722669000)",
                "description": "An amazing circle!",
                "lat": 42.5722669,
                "lng": -83.488559,
                "radius": 0.010840289
            }]
}
Creating a Google Map
Let’s create a very basic map to display our objects:
<!DOCTYPE html>
<html>
  <head>
    <meta name="viewport" content="initial-scale=1.0, user-scalable=no">
    <meta charset="utf-8">
    <title>Beacons and Geofences Map</title>
  </head>
  <body>
    <div id="map"></div>
    <script>
       function initMap() {
        map = new google.maps.Map(document.getElementById('map'), {
          center: {lat: -34.397, lng: 150.644},
          zoom: 5,
          mapTypeId: google.maps.MapTypeId.ROADMAP
        });
      }
    </script>
    <script async defer
    src="https://maps.googleapis.com/maps/api/js?key=YOUR_API_KEY&callback=initMap">
    </script>
  </body>
</html>
Displaying Beacons and Geofences
Now, displaying the Beacons, looping the response object and:
var markers = [];
//Creating the icon
var icon = new google.maps.MarkerImage('/path/to/icon/image.png', new google.maps.Size(32, 32));

//Let's display the Beacon address when clicked on the arrow
var markerContent = '<p>' + beacons.address + '</p>';

var infoWindowMap = new google.maps.InfoWindow({
    content: markerContent
});

//Now the marker, our Beacon
var marker = new google.maps.Marker({
    position: {
        lat: beacon.lat,
        lng: beacon.lng
    },
    draggable: false,
    icon: icon
});
// When we click on the marker, show the window with the address
marker.addListener('click', function() {
    infoWindowMap.open(map, marker);
});

//Closing the info Window with when the mouse is out of the beacon
google.maps.event.addListener(marker, 'mouseout', function() {
    infoWindowMap.close();
});

//Setting the beacon in the map
marker.setMap(map);
//Let's store these beacons in an array, so we can cluster them!
markers.push(marker);
//Clustering the beacons
var options = {imagePath: '/path/to/cluster/image'};
var cluster = new MarkerClusterer(map, markers, options);
To display the geofences, it is as simple as it can be. Looping the geofences object, we need to know what type of object we’ll create, as the API has different options and functions for polygons and circles:

//Configuration for objects type: POLYGON
if (geofence.type == 'POLYGON') {
    var paths = geofence.coordinates;
    var polygon = new google.maps.Polygon({
        paths: paths,
        strokeColor: '#FF0000',
        strokeOpacity: 0.8,
        stokeWeight: 2,
        fillColor: '#FF0000',
        fillOpacity: 0.35
    });

    //Set the polygon in the map
    polygon.setMap(map);

    //Plot the bounds
    var bounds = new google.maps.LatLngBounds();
    for (var i = 0; i < paths.length; i++) {
        bounds.extend(paths[i]);
    }
    map.fitBounds(bounds);
} else {
    //It is a circle!
    var circle = new google.maps.Circle({
        strokeColor: '#FF0000',
        strokeOpacity: 0.8,
        strokeWeight: 2,
        fillColor: '#FF0000',
        fillOpacity: 0.35,
        map: map,
        center: {
            lat: geofence.lat,
            lng: geofence.lng
        },
        radius: geofence.radius * 1609.344,
    });
    //Set the circle in the map
    circle.setMap(map);
    //Plot the bounds
    var bounds = new google.maps.LatLngBounds();
    bounds.union(mapType.getBounds());
    map.fitBounds(bounds);
}
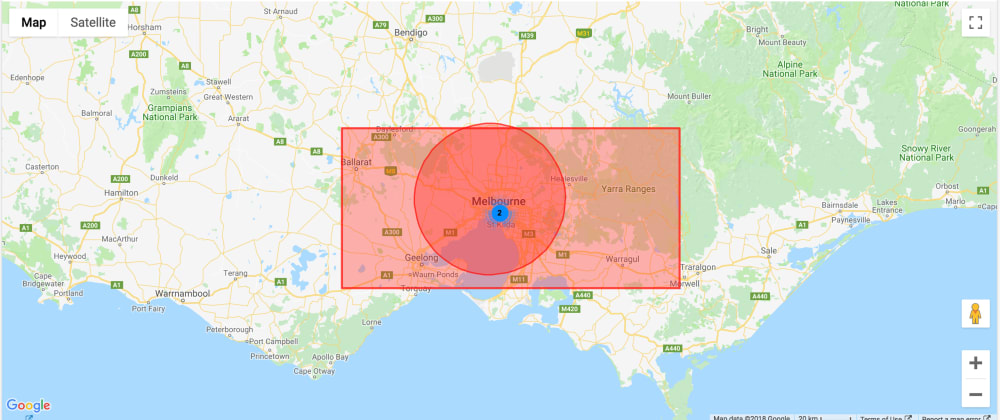
Final Result, Map done!

The map should look as cool as that!
The result is a very nice map combining Geofences and Beacons and this info is handy for many things! The Google Maps JavaScript API really makes the task easy and trustful, with a few code lines, show where your geofences are and what beacons you have around!

|
Lorena Santana - Platform Developer System analyst/Web development in the last +8 years with different technologies and methodologies. Experience with ERP's, CMS and frameworks such as CakePHP, Bootstrap and Wordpress. Full stack developer, self-taught, expertise in database modeling and maintenence, also in requirements gathering. Experience with agile methodologies and work well under pressure. Experience with interns.
|


Top comments (0)