As a cloud service provider, observability is a critical subject as it's strongly related to the availability of the services running on the platform. We need to understand everything that is happening on
our platform to troubleshoot errors as fast as possible and improve performance issues.
A year ago, while the platform was still in private beta, we faced a tough reliability issue: users were facing random 5xx errors when accessing their applications.
Diagnosing where this error came from was a time-consuming task as it required us to collect information spread across multiple components of our service mesh. Needless to say, from a user perspective, random 5xx errors are not a good experience.
The Koyeb platform natively provides an edge network, global load-balancing, and a service mesh which means troubleshooting and tracing requests between these components is our responsibility. We had metrics and logs, which are great for monitoring the performance and troubleshooting issues at the service level, but they are not enough to understand behavior and troubleshoot across services. We decided to set up distributed tracing.
Today, we will dive into how we added end-to-end tracing to the HTTP requests that flow through our global load-balancing layer to any service running on the platform.
If you're curious about how we process client requests, we also wrote about we built our multi-region service mesh.
- Our goal: Identify and diagnose performance issues faster
- Understanding tracing: a quick look at traces and spans
- Selecting our distributed tracing backend and telemetry collector
- Implementing end-to-end tracing
- Support for exporting spans in Jaeger format
- Trace sampling is mandatory
- Looking forward: better sampling, improved retention, and tracing for Koyeb users
Our goal: Identify and diagnose performance issues quicker
We wrote about the life of a request on the platform in
Building a Multi-Region Service Mesh with Kuma/Envoy, Anycast BGP, and mTLS,
but how do you track down failures with such a setup?
Observability is crucial. The purpose of observability is to track and understand what is happening between services.
OpenTelemetry defines observability as the ability to understand an application's behavior and performance based on its telemetry data, such as logs,
metrics, and distributed tracing. In this post, we are going to focus on tracing. If you want to dive into the other telemetry subjects, OpenTelemetry provides excellent explanations on these different topics.
Troubleshooting issues requires being able to track a request as it travels between all of the services and components processing this request. In our setup, this is a challenge as we have thousands of services running on the platform, and each request flows through multiple components before reaching the microVM where the service runs.
As a cloud service provider, we need to understand everything that is happening on our platform to troubleshoot errors as fast as possible and improve performance issues. Our key goals with adding end-to-end tracing are:
1. Find and diagnose failures in our global load-balancing and service mesh layers quicker;
2. Improve the quality of our support responses by delivering concrete answers faster;
3. Identify performance bottlenecks faster.
With these goals in mind, we needed to design a system that tracks the path of a request, collects meaningful information about that path, and then organizes the necessary information coherently.
Understanding tracing: a quick look at traces and spans
Before diving into our architecture, there are two key notions to understand end-to-end tracing:
Traces: Traces describe the paths a request takes as it travels through multiple components, also named services. Traces are composed of all the spans that are emitted when the request is handled by services, beginning with a root span when the request hits the first service.
Spans: Spans are the named and timed representations of a service in the path of a request.
Spans contain information related to how the request is processed, such as the name of the operation it represents, a start and end timestamp, a set of attributes, and the span's context, which represents the relationship of one span to another in a trace. Here is an example of a span.
Spans put together form a trace. A root span is the parent span, which can have any number of child spans. Each of those spans can also have child spans and so forth. This schema displays an example trace made up of a root span and its child spans.
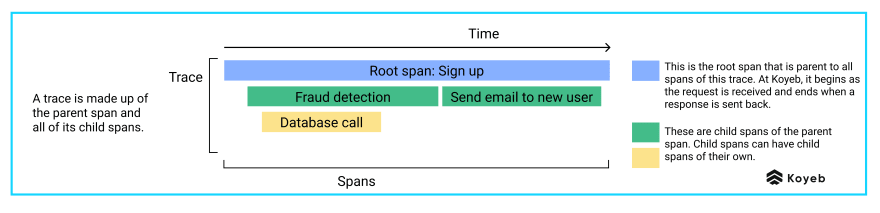
Child spans: We create child spans for operations that are usually longer, mostly things that go over the wire like API calls and database queries. If an operation takes significantly longer to perform than expected, some investigation is required and we directly know which component is faulty.
Anatomy of a span
Spans include mandatory fields and optional tags, and they can be represented as a JSON document like this one:
{
  "traceid": "123abc4d5678ef91g234h",
  "spanID": "a12cde34f5gh67",
  "parentSpanID": "a1b2345678c91",
  "operationName": "/API"
  "serviceName": "API"
  "startTime": 1608239395286533,
  "duration": 1000000,
  "logs": []
  "tags": [{
    "http.method": "GET",
    "http.path": "/api"
  }]
}
This is an example Koyeb span.
Mandatory fields: The
traceidfield is how the tracing backend knows that spans are emitted from the same request: if they share the sametraceid, that's the same request. The duration field indicates the time taken by an operation.Custom tags: You can also add any tag you want to a span. We use custom tags to keep track of all kinds of useful debugging information like IPs, core location IDs, URLs, and more. Tags are super efficient to streamline troubleshooting in a large environment. For instance, we use it to identify localized outages: we include tags with the datacenter where an operation is performed and can quickly distinguish between a generalized outage affecting all datacenter or localized ones.
Selecting our distributed tracing backend and telemetry collector
Now that we understand the basics, we need the right tools:
- A distributed tracing backend displays the tracing and telemetry data we need to monitor and troubleshoot.
- A telemetry collector collects, buffers, processes and exports telemetry data, such as spans, logs, and metrics.
There are several options when it comes to distributed tracing backends like Zipkin, Grafana Tempo, and Jaeger.

Our distributed tracing backend: Jaeger
We had been using Jaeger for the tracing of our internal APIs for several months and found it to be a reliable solution, so we decided to also use it for tracing all users' requests.
For those who are unfamiliar with it, Jaeger was developed by Uber Engineering and was inspired by Google’s Dapper and OpenZipkin. It provides Zipkin’s feature set plus dynamic sampling, a REST API, UI, and support for in-memory datastores. Jaeger’s distributed architecture makes it highly scalable.
Our telemetry collector: Grafana Agent
For our telemetry collector, we looked at Grafana Agent and OpenTelemetry Collector:
Grafana Agent is an open source telemetry collector that was built using OpenTelemetry. It supports receiving traces in a wide range of formats and sends telemetry data to a distributed tracing backend.
OpenTelemetry Collector is OpenTelemetry’s vendor-agnostic telemetry collector. It is compatible with Jaeger, which is great for our use case. When we tested it, we saw it worked great out of the box. Unfortunately, at the time we were making this decision, OpenTelemetry Collector only handled traces, not logs or metrics.
We wanted our telemetry collector to collect and process all of our telemetry data, logs and metrics included and decided to opt for Grafana Agent, which we already used to collect metrics and logs.
Implementing end-to-end tracing
As we explain in this post on our engine, we provide a built-in Service Mesh based on Kuma and Envoy. For end-to-end tracing to work, we need each component in the request's path to be configured to emit child spans when processing a request. Each of those child spans includes the unique traceID of that request.
These traceIDs can then be used to find all of the relevant information about specific requests in our tracing backend, Jaeger.

Our edge network attributes a unique traceID to all requests
As soon as a request reaches our global edge network, it automatically receives a unique traceID. This traceID is added as an HTTP header to the request and can later be included as an attribute for all the following spans.
The request is then routed to the nearest core location where the requested service is running.
Instrumenting all components in a request's path to emit spans
Once the request enters that core location, the first span on the platform is generated by our Ingress Gateway. Then, the request is routed to an Envoy sidecar proxy running aside of the Firecracker microVM
running an instance of the requested application.
Basically, all Envoy proxies are configured to send spans to Grafana Agents running on the core location.
Grafana Agent collects
On each server in our core locations, we have a Grafana Agent which gathers logs and metrics emitted by the microVMs that we use to run our client workloads. In addition to logs and metrics, a Grafana Agent can also listen to spans.
Just as it does for logs, the Grafana Agent sends the spans it receives to our control plane. Grafana Agent also performs probabilistic sampling to keep 1% of spans before passing the information collected to Jaeger. (We elaborate on this below.)
Jaeger provides visualization
Jaeger is then in charge of grouping together spans that belong to the same trace, a.k.a having the same traceid, so we can view the life cycle of a request in a nice flame graph. With Jaeger UI, we can query these traces and see the entire life cycle of a request, creating a clear path for server-side error investigations.
We run a minimalist setup of Jaeger with a single instance persisting data on disk and a retention limited to two weeks. If this Jaeger instance fails, Grafana Agents will retry sending the spans until the new instance of Jaeger spins up and goes live. Even though we could configure Envoy to emit spans directly to Jaeger, sending them to Grafana Agent improves reliability in case of a temporary outage among other benefits.
Support for exporting spans in Jaeger format
As we were looking to use Grafana Agent for our telemetry collector, we realized it was only able to export traces in OpenTelemetry (OTEL) format.
At the time, Jaeger did not support OTEL format, which meant we needed our telemetry collector to export spans in Jaeger format. We were able to push this small fix to add a Jaeger exporter on the Agent.
Fun fact, while making the PR for adding the Jaeger exporter, we discovered a bug. There was a discrepancy in the behavior of basic_auth regarding the password_file option: The final line feed was stripped from password files for logs and metrics, but not traces. Now, all 3 modules behave the same.
In the end, we switched back to using the OTEL format on both our Agent and Jaeger because Jaeger started supporting it.
Trace sampling is mandatory
As we implemented tracing on all user requests flowing through the platform, the volume of data and the associated costs quickly made it unsustainable to collect and store traces for all requests and we had to implement trace sampling.
We went with the most efficient solution we found: probabilistic sampling with Grafana Agent. 100% of the spans emitted by Envoy are sent to the Grafana Agent and Grafana Agent keeps 1% of them. We could have relied on Envoy to perform sampling, but Envoy doesn't provide advanced sampling strategies and this would not work with traces emitted by other components.
Concretely, the key challenge with sampling is to have complete traces as data is collected from multiple components. To solve this, all Grafana Agents use a hash seed to be able to sample the same traces. This allows them to hash incoming traceIDs the same way, and thus, the decision to keep or drop a span based on its traceID is consistent for all Grafana Agents. This means all traces exported to Jaeger are complete.
Looking forward: better sampling, improved retention, and tracing for Koyeb users
We already have a few key improvements in mind:
- implementing better sampling techniques as we might lose interesting traces with probabilistic sampling
- improving resiliency and retention of our tracing backend
- providing tracing capabilities to Koyeb users, as a feature
We have challenges and are looking for people to help us solve them. If this sounds interesting to you, check out our openings.
Want to stay in the loop about what is going on at Koyeb, join us over on the friendliest serverless community on Slack! Ready to give the platform a try? Create your account and receive $5 per month of free credit. That is the equivalent of two nano services, which means you can use up to 512MB of RAM. 😉


Top comments (0)