
Profiling a Python script with cProfile
What is Profiling?
As the name implies, profiling gives you a profile of a script. It evaluates items like time, call counts, and all kinds of statistics. So if you are trying to optimize a script runtime, or you are having a particular function that is taking too much time to process, you can profile the script to narrow down the issue.
cProfile module comes bundled with python. The example below runs cprofile_demo.py
Usage: cProfile.py [-o output_file_path] [-s sort] scriptfile [arg] ...
python -m cProfile cprofile_demo.py
It will print the output to the console:
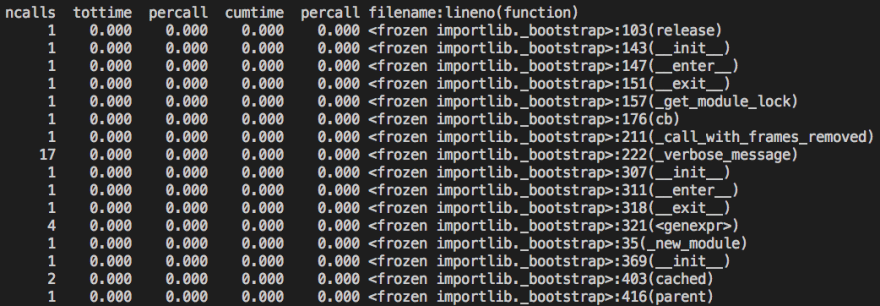
- ncalls is the number of calls made.
- tottime is a total of the time spent in the given function.
- percall refers to the quotient of tottime divided by ncalls
- cumtime is the cumulative time spent in this and all subfunctions. It’s even accurate for recursive functions!
- The second percall column is the quotient of cumtime divided by primitive calls
- filename:lineno(function) provides the respective data of each function
Argument Options
Below are some of the arguments you can use for sorting. Full Docs
| String Arg | Enum Arg | Meaning |
|---|---|---|
| 'calls' | SortKey.CALLS | call count |
| 'cumulative' | SortKey.CUMULATIVE | cumulative time |
| 'cumtime' | N/A | cumulative time |
| 'file' | N/A | file name |
| 'ncalls' | N/A | call count |
python -m cProfile -s cumtime cprofile_demo.py

python -m cProfile -s ncalls cprofile_demo.py

As you can see there's a wealth of information regarding your script execution performance. However, many people like to see things in a more visual manner.
QCachegrind Visualization
First install qcachegrind with brew if you are on a mac. For linux, and windows you'll have to compile from source or find a compiled installer.
Not tested, try at your own risk : )
- Link for Ubuntu Install script
- Link for Windows Windows installer
Mac Install
brew update
brew install qcachegrind
pip install pyprof2calltree
First we need to output the profiling results to a file:
python -m cProfile -o myscript.cprof cprofile_demo.py
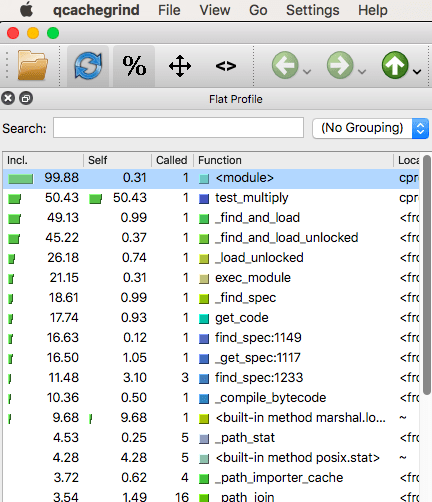
Then we can open it in qcachegrind:
pyprof2calltree -k -i myscript.cprof

Conclusion
My small script doesn't do justice but I hope you get the idea of profiling with these awesome tools. I first used profiling, when doing a challenge in codewars that was not passing due to being so slow. After finding what was the bottleneck, I then step through that function, and figured out how to optimize it. Thank you for reading!


Top comments (0)