One of the key metrics in DevOps is availability, that is: measuring how much, over a given period, your service or app is available or accessible. Often, availability is paired with scalability, or the measure of how well your service performs in proportion to a growing number of users. Among other things, availability and scalability comprise a big chunk of observability in control theory -- the practice of inferring the internal state of a system through external observations. We'll get back to observability at a later post, but in this one, we'll focus on just availability, and how to get started with it.
The most straightforward way of measuring availability is by measuring service uptime. Often, DevOps engineers and SREs aim to achieve the five-nines of availability, which means that a service is available 99.999% of the time.
Let's define a couple of goals:
- We can see if a service is "up" by performing an HTTP GET request on a known endpoint
- We get notified whenever a service "goes down" or "comes back up" (ie its state of availability changes)
- And finally, we can log all of these somewhere for posterity
Introducing Bantay
Sometime back, I needed to achieve pretty much those same three goals with a couple of constraints: one, that the manner by which I achieve those goals is cheap (or free), and two, I have total and absolute control over my data and how I perform my monitoring. While solutions such as Pingdom, Rollbar, New Relic, and Statuspage exist, none of them are completely free and none of them offer complete control over my data. Hence, I built my own: Bantay.

Bantay aims to be a lightweight, extensible uptime monitor with support for alerts and notifications.
It's very easy to get started. First, we write a configuration file called checks.yml:
---
server:
  poll_interval: 10
checks:
  - name: Dev.to
    url: https://dev.to/
    valid_status: 200
    body_match: dev
  - name: Local Server
    url: http://localhost:5555/
    valid_status: 200
reporters:
  - type: log
Let's go through the YAML file line by line:
server:
  poll_interval: 10
Here we define a server section, and we tell it to have a poll_interval of 10. When we run Bantay in server mode later, this is the frequency with which it will perform uptime checks.
checks:
  - name: Dev.to
    url: https://dev.to/
    valid_status: 200
    body_match: dev
  - name: Local Server
    url: http://localhost:5555/
    valid_status: 200
Next we define a checks section, with a couple of entries: Dev.to and Local Server. The fields are pretty self-explanatory, with url being the endpoint which Bantay will perform an HTTP GET to check uptime, valid_status being the HTTP status code we expect to get, and body_match being an optional string in the response body we expect to see.
reporters:
  - type: log
In the reporters section, we put one object with the type log. This will log the checks in stderr/stdout.
Before we actually start Bantay, let's go ahead and quickly start a Python HTTP server to listen on port 5555 locally (four our Local Server check):
# on Py2
$ python -m SimpleHTTPServer 5555
# on Py3
$ python3 -m http.server 5555
For Mac OS users: Modify
checks.ymlto usehttp://docker.for.mac.host.internal:5555/instead ofhttp://localhost:5555/
Finally, we pull the latest Bantay Docker image, and run a check:
$ docker run -v "$(pwd)/checks.yml":/opt/bantay/bin/checks.yml --net=host fipanganiban/bantay:latest bantay check
We should get something similar to:
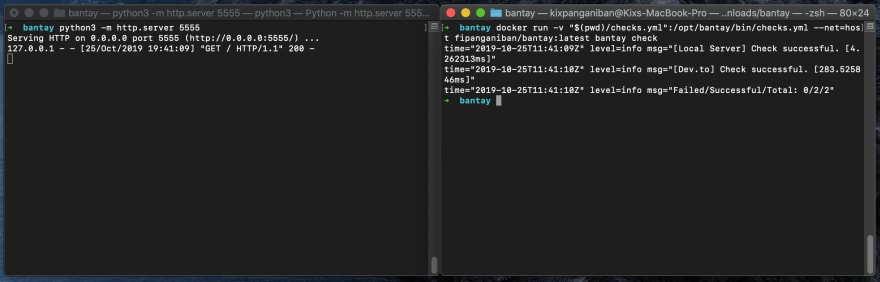
Looks good!
If we kill the running Python server and run Bantay check again, we should get:

Bantay Server
A one-off check does little to help us measure availability. Most of the time, we want to perform these checks regularly and get notified whenever something goes down after a check. For that, we run Bantay in server mode:
# start the local Python HTTP server again
$ python3 -m http.server 5555
# and start Bantay in server mode
$ docker run -v "$(pwd)/checks.yml":/opt/bantay/bin/checks.yml --net=host --name bantay fipanganiban/bantay:latest bantay server
We can also add a Slack reporter to let us know when a service goes down. Add the following to the bottom of your checks.yml file (replacing YOUR-SLACK-CHANNEL-HERE and YOUR-SLACK-TOKEN-HERE):
  - type: slack
    options:
      slack_channel: YOUR-SLACK-CHANNEL-HERE
      slack_token: YOUR-SLACK-TOKEN-HERE
Now, when we kill the Python server again, Bantay should detect that it went down and we get a handy notification through Slack:

And if we start the Python server again, Bantay should detect that as well:

Final notes
And that's it! You should now be able to set basic uptime checks with Bantay, in just a few lines of YAML. At the time of writing, Bantay also supports notifying via email (using Mailgun), and sending metrics to InfluxDB (for graphing and storing history). Learn more about all its current features, and how to build Bantay as a binary, in its Github repo: https://github.com/kixpanganiban/bantay


Top comments (0)