When playing Role Playing Games (like Dungeons & Dragons) on a Virtual Tabletop (like Roll20). You often want to configure a grid for the map. This allows measuring distances and allowing players to snap to the grid. It can also make drawing virtual walls and doors easier.
Furthermore I often like to use premade maps such as those posted to https://battlemaps.reddit.com. While it can be difficult to find a premade map that fits your story perfectly I find that adjusting my story slightly to fit the map is worth the benefit of an excellent map that looks great and has a lot of detail that I wouldn’t think to include if I made it myself.
However a common issue with premade maps is that you don’t know what grid size will best fit. So using gridfinder you can quickly identify the dimensions. For example click here to try it out with this smithy map by Morvold Press. as an example. This example does have the dimensions listed, but you can imagine how the tool is helpful if they weren’t.
The Tool
The tool is Gridfinder and is very simple. You just add your map (enter URL, select and image file, drag & drop and copy+paste all work) then click a couple of “intersection” points. I have a video tutorial you can watch to see how it works.
The tool is completely open source, both the website and a JavaScript package to use the algorithm. Let me know if you integrate it into any projects!
The rest of the article discusses the algorithm in use. The tool could definitely use some UX improvements but I’m not a UI developer and am unlikely to share great wisdom on creating UIs. (UX patches welcome though 😉)
The Algorithm
The full algorithm as of the time of writing is available here. This code in this post isn’t simply copied from the source, instead it has been rewritten in a simplified form. Some optimizations have been omitted in the name of readability so please check the current version before filing bugs or sending patches.
The algorithm is currently very simple but seems to work well. It simply takes the list of clicks as input and returns a guess at the grid size and offset. Here is how it works.
Find Extents
The first thing it does is calculate the leftmost, rightmost, topmost and bottommost coordinate of the provided points. From those it then derives the width and hight of the smallest rectangle surrounding the clicks. Note that it does not use the size of the image. Everything is based off of the clicks.
let minX = Math.min(...points.map(p => p.x));
let maxX = Math.max(...points.map(p => p.x));
let minY = Math.min(...points.map(p => p.y));
let maxY = Math.max(...points.map(p => p.y));

let width = maxX - minX;
let height = maxY - minY;
Reference Point
The algorithm will use (minX, minY) as a reference point for some operations. This is to avoid rounding points in the wrong direction. You can imagine that if the offset was roughly half of the grid size the nearest intersection for each point would change based on small imprecision in the click. To avoid this problem we use a reference point that is expected to be close to an intersection. If the reference point is way off we will round a point the wrong way and come up with a bad result however if the reference point is good (as it usually is) everything will run smoothly.
let reference = new Point(minX, minY);
Rank Candidates
The algorithm then considers every possible way to subdivide the width as a candidate. Then it simply calculates the mean squared error for every candidate cell size.
const MIN_PIXELS_PER_CELL = 8;

let minCells = 1;
let maxCells = width / MIN_PIXELS_PER_CELL |0;

let candidates = [];
for (let cells = minCells; cells <= maxCells; i++) {
    let cellSize = width / cells;

    let offset = calculateOffset(cellSize, points);
    let error = 0;
    for (let point of points) {
        let offsetCorrected = point.sub(reference);
        let nearestIntersection = offsetCorrected.round(cellSize);
        let missedBy = offsetCorrected.sub(nearestIntersection);
        let relativeMiss = missedBy.divide(cellSize);
        error += Math.pow(relativeMiss.length, 2);
    }

    candidates.push({cellSize, error});
}
candidates.sort((a, b) => {
    // Prefer smallest error.
    if (a.error != b.error) return a.error - b.error;

    // Break ties with largest cell size.
    return b.cellSize - b.cellSize;
})
There are a couple of important things to note here:
- The error is calculated relative to the cell size. So if your click was ¼ of a cell high and ¼ of a cell right; it would calculate the error as
(-0.25, 0.25)error. This encourages picking a larger grid as the same absolute distance away will result in less relative error. - Ties are broken by the largest grid. Ties should be really rare, only if you manage to click perfectly (however since the website uses sub-pixel accuracy for reporting clicks that is almost impossible).
- It uses a hardcoded minimum cell size. This both saves some work and avoids picking tiny grids because they happen to be a “perfect match”.
Example Execution
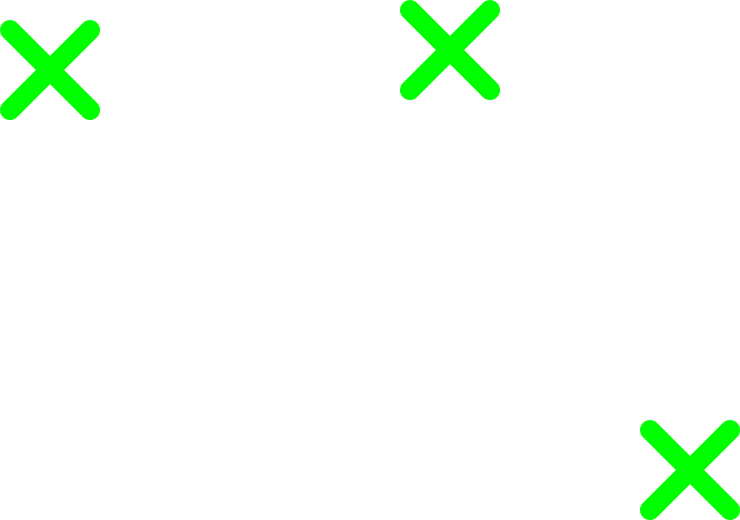
Clicks
Say we have the following three clicks.
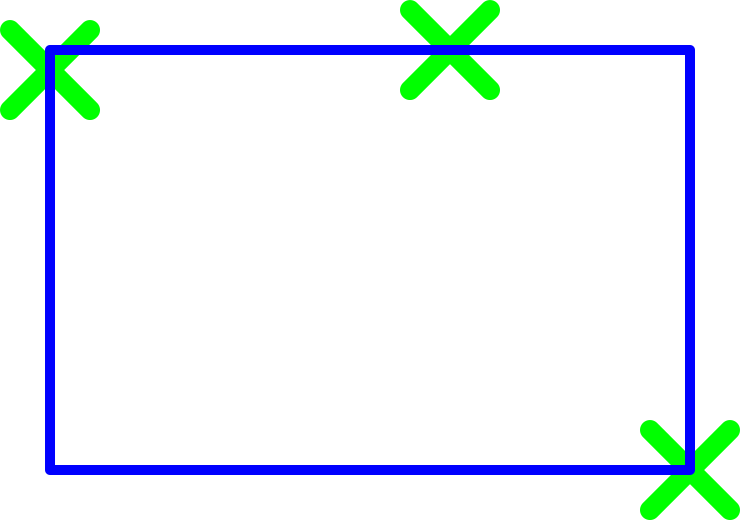
Bounding Box
First we calculate the bounding box of the clicks.
Score Candidates
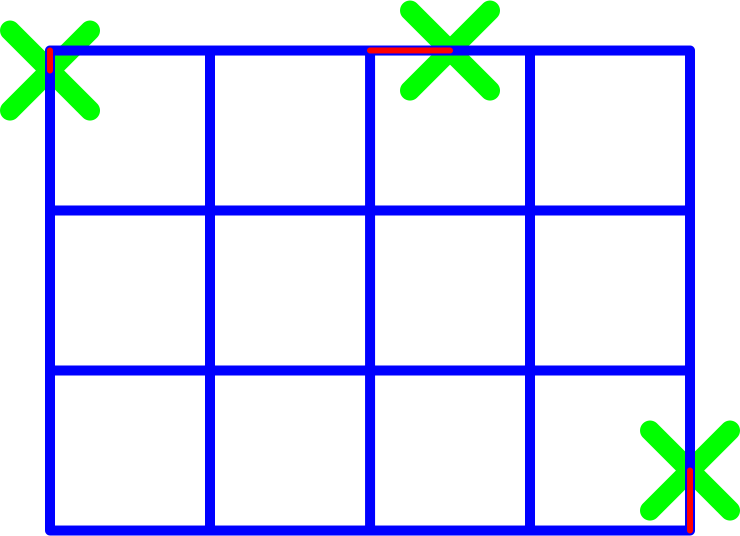
Next we start dividing the bounding box’s width and calculating the errors between the click locations and the nearest intersection. In the following images the clicks are the green crosses, the candidate grid is blue and the error for each point to the nearest intersection is shown in red. A selection of interesting divisions are shown.
By 2
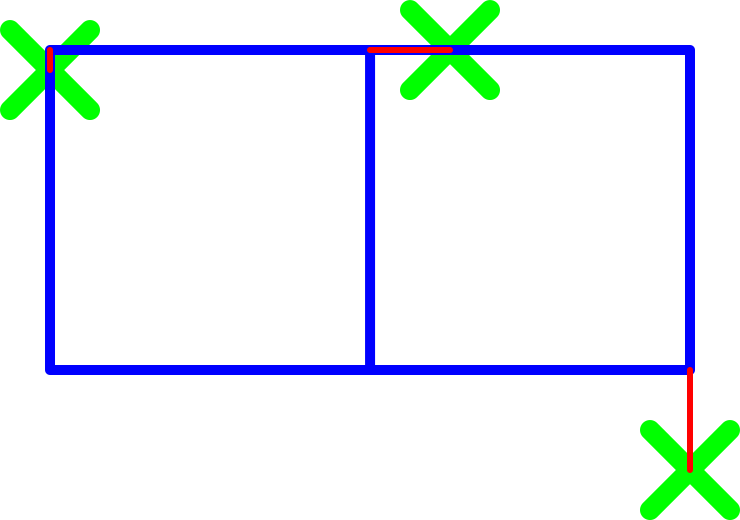
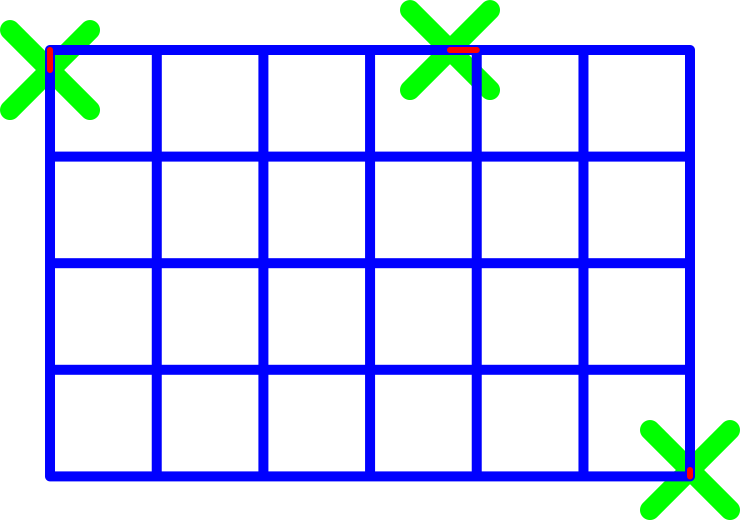
By 3
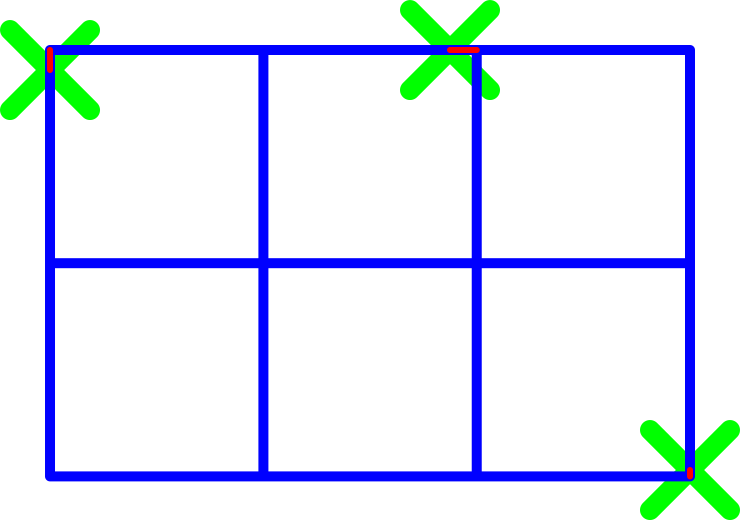
By 4
By 6
After running the numbers we end up with:
| Cells | Cell Size | Click 1 Error | Click 2 Error | Click 3 Error | Squared Summed Error |
|---|---|---|---|---|---|
| 2 | 1.6 | 6.3% | 25% | 31.3% | 0.199 |
| 3 | 1.067 | 9.38% | 12.6% | 3.0% | 0.026 |
| 4 | 0.8 | 12.5% | 50% | 37.5% | 0.406 |
| 6 | 0.534 | 18.7% | 25.1% | 6.0% | 0.102 |
You can see that dividing the width by 3 and 6 are the top two candidates. This makes sense as they were very close to the grid size of 1 that I used when making the example. The numbers are not perfect because the clicks are not. However you can see that it managed to make a very good guess.
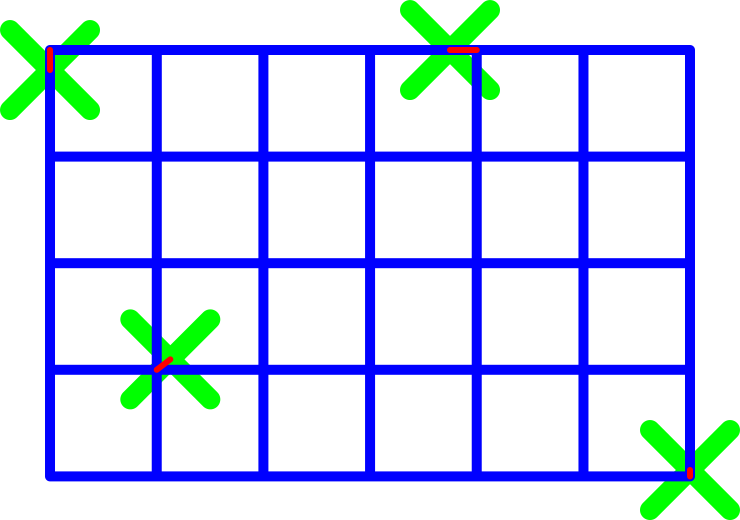
Also notice that the absolute error of the 3 and 6 division are identical. This will be true for any multiple of the optimal grid size. However because we normalize the error by the cell size the calculation will prefer the larger grid. If the user wants the smaller grid they will have to select a new intersection that isn’t on the grid. That intersection will then be much closer for the 6 division grid and will cause that to be selected. See a possible disambiguating click below:
Calculating Offset
The algorithm was designed to be indifferent grid offsets. Offsets are not uncommon as many maps start mid-cell for stylistic reasons or simply because the image has a border before the grid begins. This is done by detecting and correcting for any offset. This detected offset is also reported to the user so that they can configure their VTT to account for any offset.
The algorithm used is trivial. It simply takes the average error of all of the points (as a vector) and reports that as the offset.
function findOffsetPoint(cellSize, points) {
    let relativeShift = points
        .map(p => {
            let offsetCorrected = p.sub(reference);
            let nearestIntersection = offsetCorrected.round(cellSize);
            return nearestIntersection.sub(offsetCorrected);
        })
        .reduce((a, b) => a.add(b))
        .div(points.length);

    let nearestIntersection = reference.round(cellSize);
    let referenceError = nearestIntersection.sub(reference);
    return relativeShift.add(referenceError);
}
Future Work
Non-rectangular grids.
Right now I run the algorithm in two dimensions. But you could also run it for each dimension separately. This would allow you to identify non-rectangular grids. The downside is that some combinations of points that work with the square assumption don’t provide enough information without it. For example the clicks used in the demonstration above would be able to solve the X cell size but don’t have enough information to produce the correct Y size without assuming that it is the same. However having this option behind an option would still be useful as right now you would have to manually solve each dimension separately.
Better Extent Detection
Currently the furthest coordinate in each direction is used as the extent. However if you have multiple clicks around the border it would make sense to do some sort of average. As it is now, as you add more clicks it becomes more likely that the estimated grid will be too large simply due to some clicks being outside of the grid.


Top comments (0)