In this article I will take a very simplistic approach in understanding memory leaks and I will also attempt to diagnose them.
In todays world of abundant memory, we seldom worry about memory leakages. But I hate to tell you that we live in a real world and nothing comes for free.
Oh my fancy functional programming
Disclosure: I absolutely love functional programming.
Functional programming is cool and with the new ES6 syntax it becomes even cooler.
const arrayAddFirst = (a, b) => [a, ...b];
This example above looks super good. Unless you bro-program with me and I blindly put it inside a heavy duty loop 😎.
result = newData.reduce((p,r) => arrayAddFirst(r, p), []);
Now I don't want you to judge me for the idiot code above. (virtual hug if you can guess what it does 😁)
for(var i = 0; i < newData.length; i++) {
    for(var j = 0; j < i; i++) {
        // stuff here
    }
}
The above code snippet is the old fashion equivalent of our example. Notice how easy it is to see it will run n * (n+1) / 2 times, where n is the length of newData.
The main problem in the example code is that the garbage collector has to kick in frequently. The fancy [a, ...b] array you create every time in the .reduce loop needs to be removed from memory or else it will eventually consume all of the memory.
This example tries to shed light on the important fact that memory is not your best friend. It works in your favour 99% of the time, but when it decides to stab you, it directly stabs you in the eye.

Memory Leaks ….
Generally a javascript application can freeze in two ways:
Infinite loops: You might have accidently written a loop which never terminates.
var x = 0;
while(x < 5) {
   console.log(x); // Warning! do not try this at home
}
Running out of memory: We all know there is limited amount of memory in a computer and if we are not careful we might end up hogging all of the memory.
var x = [ [1] ];
for(var i = 1; i < 100000; i++) {
    x.push(arrayAddFirst(i, x[i-1])); // Warning! do not try this at home
}
Alright, but what about Memory Leaks??
Ofcourse, you can easily avoid these bad behaviours by being careful. But Memory leaks are one of those nasty devils which silently sit.
Let us define a computer which has infinite resources and let's call it Deep thought. We will refer to Deep thought in this article DT-42 and you will soon see how we will use DT-42 to figure out memory leaks.
Memory Leaks
A Memory leak in simple terms is forgotten data forever waiting to be used.
Let us see an example before we jump to a scientific definition.
function sayHi() {
    var allNames = [];
    var emoji = '👋';
    return name => {
        allNames.push(name);
        return emoji + name;
        }
}
In the example, our program is becoming fatter everytime we call it. The garbage collector is not able to cleanup allNames because the function needs it to push data. It cannot figure out that allNames would never be read and hence it is futile to give it any space in memory.
The Wikipedia says:
memory leak is a type of resource leak that occurs when a computer program incorrectly manages memory allocations[1] in such a way that memory which is no longer needed is not released.
I find it much easier to understand the concept by thinking of it as a symptom. Your program is the patient whose love for memory keeps on increasing without bound.

Most of the time the computer (Garbage Collector) is good enough to spot most of data that you wouldn't be using anymore and cleans it up for you. But it is not perfect and we are far from having a garbage collector smarter than humans. (If we did have one, it would be writting the code and not us :P)
Give me some real life leakages
The problem with our real life is that we don't encounter such trivial memory leaks and most often the leakages are lurking behind a seemingly well behaving piece of code (Something as innocent looking as arrayAddFirst). Instead of throwing some real life leakages I would rather show you how to identify a memory leak.
Let us fire Chrome to help diagnose memory leaks.
- Open up an empty page.
- Open the dev panel (Command+Option+I or Control+Shift+I)
- Paste this example code in the console.
function sayHi() {
    var allNames = [];
    return name => {
            allNames.push(name);
            return '👋 ' + name;
        }
}
var hello = sayHi();
hello('Gandhi');
Alright, we have started leaking memory already, now let us open our memory profiler.
You should be able to find it as a memory tab in the dev tools.
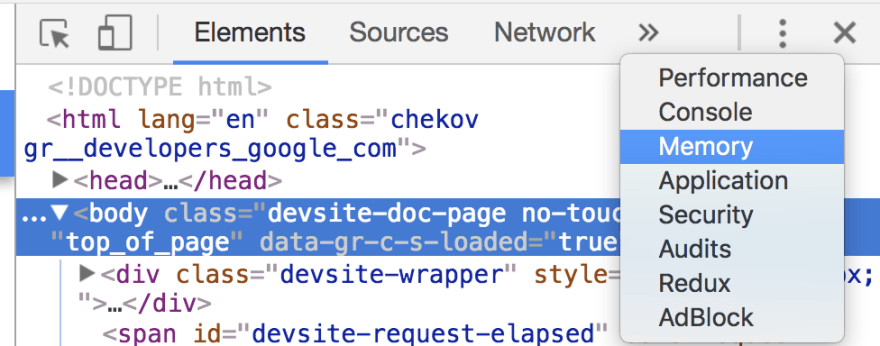
For the scope of this article we will focus on Take Heap Snapshot. This functionality takes snapshot of the current memory usage of your program.
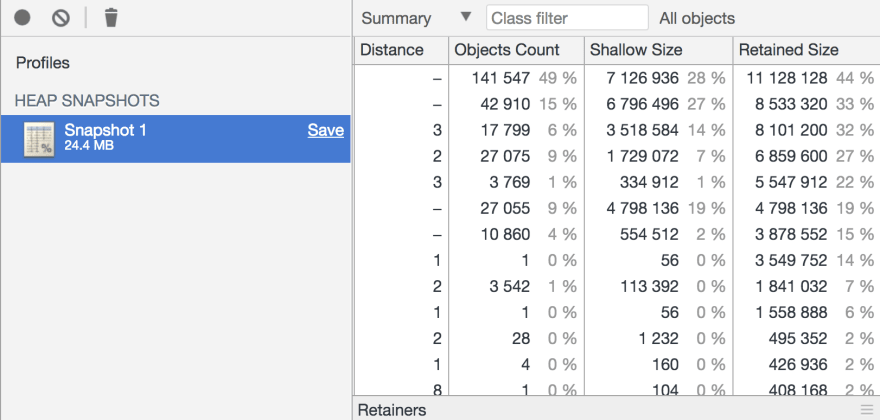
In my case it looks something like this:
Great, now we will run our innocent looking function a couple of times.
for(var i=0; i<1000000; i++) {
    hello('Gandhi');
}
If you take another snapshot, you will see an increased memory usage.

In my case there is a complete difference of 10 megabytes. In a lot of real life cases a jump of several megabytes might be normal and you might want to take multiple snapshots over a span of time to rule out a leak.
You can easily compare two snapshots by clicking on the Summary dropdown and switching to Comparison.

If you compare your new snapshot with the one you took earlier and put #Delta to descending, you will find a huge number in the (string). This is where our memory is leaking. Click on it and you will see a lot of Gandhi's.
I really hope this article helped you in understanding memory. This is just one of the several approaches one can take to diagnose a leakage. Please check out the following links for a more advanced take on memory:
If you ❤️ this article, please share this article to spread the words.
Reach out to me on Twitter @kushan2020.


Top comments (10)
This is gold and exactly what I needed! I'm writing a thing on analyzing performance issues and I almost forgot about memory leaks. Thank you :).
Thanks for your kind words.
Nice post! Chrome dev tools are awesome
I'd say it reverses the order of the elements.
To me, it is easy to see it is an infinite loop :'D
With j++, it would run 0 + 1 +...+ n-1 times. Thus, n*(n-1)/2 times.
This article is a simple tutorial to memory leak & its analysis in a web browser =) I used Firefox 60 instead of Chrome without any hassle.
Thank you !
But after you invoke the function, the GC needs to collect it, no?
var hello = sayHi();
hello('Gandhi'); <=== I'm done
If we were in the global scope you are right, but if I'm within a scoped module, it will released the memory as soon as the second line execute.
As long as the ‘hello’ variable is in reference ( global or modular ), it will keep leaking memory.
You can run the hello function yourself and see memory usage increasing.
Thank you for very informative article!
Are you aware of any differences between JS engines when it comes to garbage collection?
I am not sure, but yes the GC varies wrt engines. I have read this great article on V8 medium.com/@_lrlna/garbage-collect...
Hope it helps you.
That's actually quite nice article, thanks!
Your example is really awesome. When I ran the example I found that old references were in (array) section. I sorted by Size Delta. Maybe due to different version of chrome.