World Statistics App.
Introduction
After implementing my web-store exercise using six languages (Clojure, Python, Javascript, Java, Go and Kotlin) and with 5 data stores (CSV, DynamoDB, Azure Tables, PostgreSQL, and Datomic, read more about in my blog posts, e.g. Five Languages - Five Stories ) I was pretty much fed up with that exercise. I wanted to do something totally different. But what? I spent quite a lot of time figuring out what to do. I was dreaming to do something with Finnish Open data that could benefit the general public. I was browsing the Finnish Open data but couldn’t figure out anything useful that would contain a lot of data points. Then I decided to take a look at the World Bank Open data. Just out of curiosity I downloaded various metrics between the years 2002-2017, some 150.000 data points altogether. Then I just started to experiment with the data using the Clojure REPL - a great tool for studying and experimenting with data. Little by little a new exercise was formed in my head: Implement a full-stack app using Clojure and ClojureScript to filter and enrich the data and visualize the data sets using a frontend. This blog post depicts the story of this exercise.
The application source can be found in my Github clojure repo in directory statistics/worldstat. The application is live in Heroku (as long as the Heroku free tier dyno hours have not run out). NOTE: If there are still dyno hours and no-one has used the app for some time you may need to wait for a while for Heroku to start the app. Since the app is running in the free tier there might be other aspects as well that may impact using the app (max connections etc.)
Technology Overview
I used Clojure, and some Clojure libraries (like reitit) to implement the backend. The backend reads the data from CSV files that I downloaded from the Worldbank site, and manipulates the data so that we have the data and meta-data nicely as Clojure data structures stored as part of the Integrant state. I used kixi as the statistics library.
I used ClojureScript, Reagent, and Re-Frame to implement the frontend. For frontend development I used shadow-cljs. For CSS I used the excellent and light CSS library Bulma. For data visualization I used Vega Lite and as a Clojure wrapper for Vega I used Metasoarous’ Oz library. The world-110m.json world map is from Vega.
Backend - Creating the Data
In main.clj I read the Integrant configuration: the data files (the CSV files that I downloaded from the Worldbank, and the toposon file) and inject them to init.clj:
(defmethod ig/init-key :backend/data [_ {:keys [data-files topojson-file]}]
  (init/get-data data-files topojson-file))
In init.clj I parse the data from the CSV files and convert it to edn. In that file I do some processing and finally return the data structure back to main.clj which stores the data as part of the Integrant state:
(defn get-data [data-files topojson-file]
  (log/debug "ENTER get-data")
  (let [topojson-country-codes (read-topojson-country-codes topojson-file)
        ids (into {} (map (juxt :acr :id) topojson-country-codes))
        data-points (get-data-points data-files ids)
        {:keys [countries series years]} (get-metadata data-points)]
    {:raw-points data-points
     :points (remove-non-country-values data-points non-country-codes)
     :countries countries
     :series series
     :years years
     :country-codes (country-codes-to-names countries)
     :series-codes (series-codes-to-names series)
     :non-country-codes non-country-codes
     :country-ids ids
     :topojson-country-codes topojson-country-codes
     }))
An important part of this processing is to store the topojson country ids as part of the data points so that we can later use them as hooks to actual countries in the topojson map.
I downloaded some 150.000 data points for this exercise (:raw-points). I removed various data points (:points) that were associated to continents, income groups, etc. Finally, I had some 130.000 data points that were associated to actual countries found in the topojson map. It’s easy to study the data using the Clojure REPL:
(count (:raw-points (user/data)))
=> 153152
(count (:points (user/data)))
=> 129824
… but more about that in the next chapter.
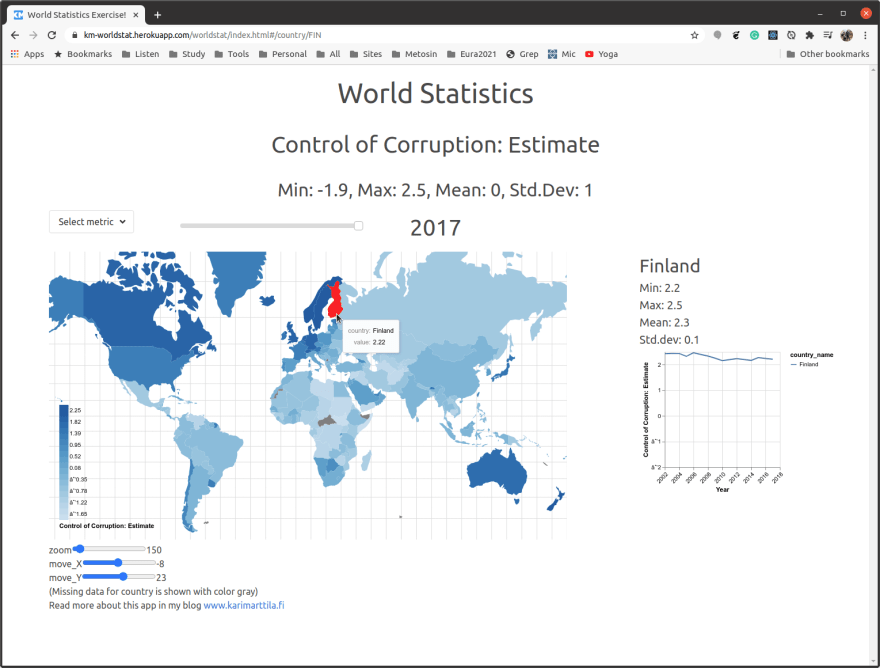
An individual data point is a Clojure map. Let’s get one data point from Finland and check it in more detail:
(first (transduce (ws-filter/filter-by :country_code :FIN) conj (:points (ws-world/get-world-data (user/env) :SH.MED.BEDS.ZS))))
=>
{:country_name "Finland",
 :country_code :FIN,
 :series-name "Hospital beds (per 1,000 people)",
 :series-code :SH.MED.BEDS.ZS,
 :year 2002,
 :value 7.4,
 :country-id 246}
Backend - Using Clojure REPL to Experiment with the Data
Using a real REPL is such a joy with Clojure. Let’s use it to experiment with the data:
(set! *print-length* 100)
=> 100 ; So that we don't accidentally list 150.000 data points in repl...
;; Require some namespaces.
(require '[worldstat.backend.data.world :as ws-world])
=> nil
(require '[worldstat.common.data.filter :as ws-filter])
=> nil
(require '[kixi.stats.core :as kixi])
=> nil
;; Check how many points there are...
(count (:raw-points (user/data)))
=> 153152
(count (:points (user/data)))
=> 129824
;; What keys do we have in our data?
(keys (user/data))
=>
(:country-codes
 :raw-points
 :series
 :non-country-codes
 :country-ids
 :points
 :series-codes
 :countries
 :topojson-country-codes
 :years)
;; Let's sort countries...
(sort-by :country_name (:countries (user/data)))
=>
({:country_name "Afghanistan", :country_code :AFG, :country-id 4}
 {:country_name "Albania", :country_code :ALB, :country-id 8}
 {:country_name "Algeria", :country_code :DZA, :country-id 12}
 {:country_name "American Samoa", :country_code :ASM, :country-id 16}
 ...)
;; Get hospital beds, filter data points belonging to Finland, and get first data point.
(first (transduce (ws-filter/filter-by :country_code :FIN) conj (:points (ws-world/get-world-data (user/env) :SH.MED.BEDS.ZS))))
=>
{:country_name "Finland",
 :country_code :FIN,
 :series-name "Hospital beds (per 1,000 people)",
 :series-code :SH.MED.BEDS.ZS,
 :year 2002,
 :value 7.4,
 :country-id 246}
;; Let's check some basic statistics, mean and standard deviation for certain data.
(transduce (map :value) kixi/mean (:points (ws-world/get-world-data (user/env) :SH.MED.BEDS.ZS)))
=> 3.668379451410944
(transduce (map :value) kixi/standard-deviation (:points (ws-world/get-world-data (user/env) :SH.MED.BEDS.ZS)))
=> 2.601440577329428
Repl is truly such a powerful tool in Lisp. I always keep a repl scratch file in all my Clojure projects and I do experimentation like above in those scratch files - it’s nice to have those experimentations later on as a historical record of how I implemented functions.
Backend - API
I used the excellent Metosin reitit library for routing: routes.clj:
    ["/data" {:swagger {:tags ["data"]}}
     ["/metric/:metric" {:get {:summary "metric"
                               :parameters {:path [:map [:metric string?]]}
                               :responses {200 {:description "data"}}
                               :handler (fn [req]
                                          (let [metric (get-in req [:parameters :path :metric])]
                                            (-> (world/get-world-data env (keyword metric))
                                                r/ok)))}}]
     ["/countries" {:get {:summary "countries"
                          :responses {200 {:description "data"}}
                          :handler (fn [req]
                                 (-> (world/get-countries env)
                                     r/ok))}}]
     ["/years" {:get {:summary "years"
                      :responses {200 {:description "data"}}
                      :handler (fn [req]
                                 (-> (world/get-years env)
                                     r/ok))}}]
     ["/metric-names" {:get {:summary "metric-names"
                             :responses {200 {:description "data"}}
                             :handler (fn [req]
                                        (-> (world/get-metric-names env)
                                            r/ok))}}]]]])
So, you can query the actual data points by giving a metric (:series-code) and the backend returns the data points for that metric. Basically, I just implemented a minimum API that is needed by the frontend to do the visualization.
Reitit library provides swagger documentation out of the box, so you can experiment with the API easily also with the browser:
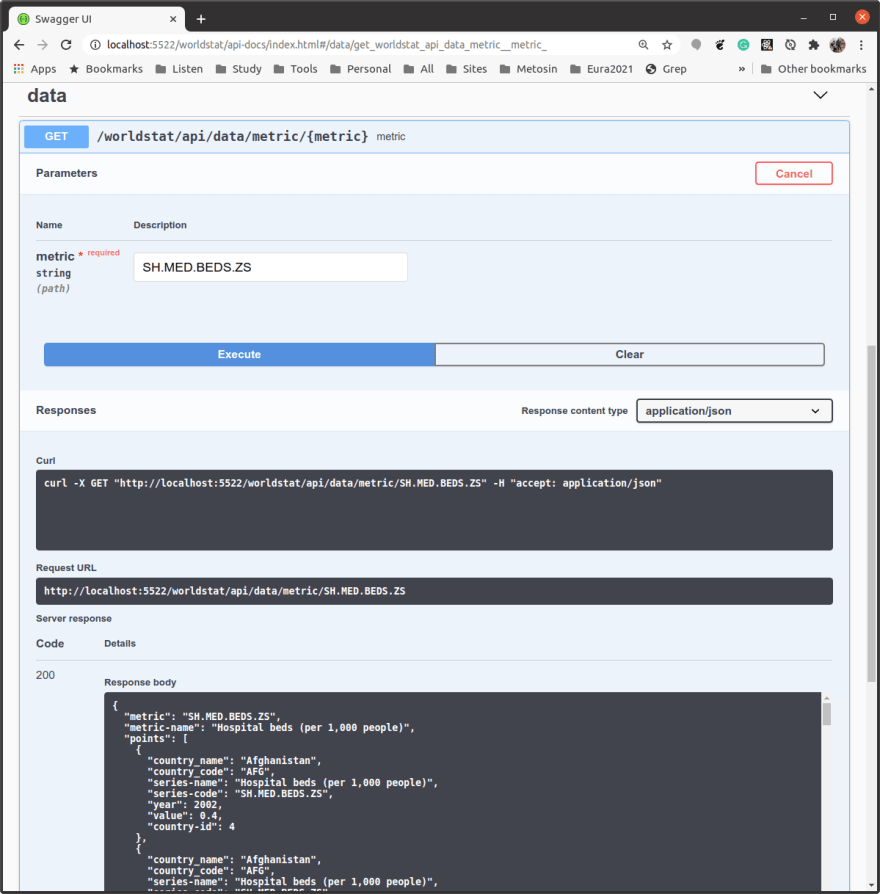
API Swagger documentation.
Next, let’s move to the frontend.
Frontend - Reagent and Re-frame
I used ClojureScript, Reagent, and Re-Frame to implement the frontend. For frontend development I used shadow-cljs. Reagent provides a nice interface to React, and Re-frame is ClojureScript framework, that uses Reagent and provides simple state management to build single page applications using Clojurescript. All this tooling works pretty seamlessly with the Clojure backend repl so that when I refresh the Integrant state (with one hot key, of course) the frontend also refreshes. One can get a Clojurescript repl and connect to the frontend application running inside the browser, if you need it. Usually you don’t, since there are nice tools and tricks to examine the frontend state.

Clojurescript frontend tools.
On the right side of the browser, you see the standard Chrome developer tools window. There you can examine the html structure, see console log, etc, nothing new for any frontend developer.
At the bottom is the Metosin reagent-dev-tools. You can subscribe to all re-frame application data there and browse the data. I also implemented a simple debug panel in which I show some most important application data that I used when implementing the frontend. Btw. I really recommend using the Metosin reagent-dev-tools. E.g. I’m in a customer project in which we are implementing a rather complex Clojure full stack application and there is really complex business logic - we have various fixtures in the reagent-dev-tools which makes it a breeze to initialize the frontend and the whole application to a certain state in the middle of the business logic.
All this tooling works really nicely. I’m an old backend programmer myself, but using these tools it was quite effortless to implement this full stack application. You don’t have to be a Javascript + React guru to implement a frontend like the one in this exercise.
CSS - Bulma
I used Bulma as a CSS framework. Bulma is really great - I barely added any custom css in this application. Let’s see part of the frontend using the hiccup notation:
[:div.row
 [:div.columns
  [:div.column.is-9
   [oz/vega-lite (ws-data/world-schema points selected-year selected-metric-name min max) (ws-util/vega-debug)]]
  [:div.column.auto
   (if country-stats
     [:div.rows
      [:div.row
       [:p.is-size-3 selected-country-name]]
      [:div.row
       [:p.is-size-5 "Min: " (ws-util/one-decimal (:min country-stats))]
       [:p.is-size-5 "Max: " (ws-util/one-decimal (:max country-stats))]
       [:p.is-size-5 "Mean: " (ws-util/one-decimal (:mean country-stats))]
       [:p.is-size-5 "Std.dev: " (ws-util/one-decimal (:standard-deviation country-stats))]]
      [:div.row
       [oz/vega-lite (ws-data/country-year-diagram points selected-metric-name selected-country-code min max) (ws-util/vega-debug)]]]
     [:p.is-size-4 "Click a country!"])]]]
[:div.row
 [:p "(Missing data for country is shown with color gray)"]]
[:div.row
 [:p "Read more about this app in my blog "
  [:a {:href "https://www.karimarttila.fi/clojure/2021/01/19/world-statistics-exercise.html"} "www.karimarttila.fi"]]]
You can use Bulma styles seamlessly with hiccup, e.g. :div.columns tells the browser to render the div using Bulma columns etc. Check more in the Bulma documentation.
The dropdown box for selecting the metric and the slider for selecting the year to visualize in the map are also Bulma components. You can customize the Bulma components quite nicely using Clojurescript, example showing the year slider:
(defn slider [id initial step min max type]
  (let [slider-value (r/atom initial)]
    [:div.slider-content
     [:input.slider.is-fullwidth {:id id :step step :min min :max max :value @slider-value :type type
                                  :on-change (fn [event]
                                               (.preventDefault event)
                                               (let [new-value (.-value (.getElementById js/document id))]
                                                 (reset! slider-value new-value)
                                                 (re-frame/dispatch [::ws-state/select-year (js/parseInt new-value)])))}]]))
So, basically I just take the current value of the slider and store it in the re-frame database: (re-frame/dispatch [::ws-state/select-year (js/parseInt new-value)]) .
Frontend - Creating the Map
For data visualization, I used Vega Lite, and as a Clojure wrapper for Vega, I used Metasoarous’ Oz library. The world-110m.json world map is from Vega.
I think I spent most of the time developing this application by tuning the world map. But it was really fun to experiment with how to visualize data and how to interact with the map. The result of this experiment can be seen in file data.cljs, I highlight here the most important part of the map configuration:
(defn world-schema [points year metric-name min max]
  {:schema "https://vega.github.io/schema/vega/v5.json"
   :autosize "none"
   :width 900
   :height 500
   :scales [{:name "color",
             :type "quantize",
...
   :marks [{:type "shape"
            :from {:data "graticule"}
            :encode {:update {:strokeWidth {:value 1}
...
           {:type "shape"
            :from {:data "world"}
            :encode {:enter {:tooltip {:signal "datum.value === null ? {'country': datum.country_name, 'value': 'Missing data'} : {'country': datum.country_name, 'value': format(datum.value, '.2f')}"}
                             :href {:field "url" :type "nominal"}}
                     ;; If missing data show as grey.
                     :update {:fill [{:test "datum.value === null" :value "gray"}
                                     {:scale "color" "field" "value"}]}
                     :hover {:fill {:value "red"}}}
            :transform [{:type "geoshape"
...
   :data [{:name "countries"
           :values (transduce (ws-filter/filter-by-year year) conj points)}
          {:name "world"
           :url "data/world-110m.json"
           :format {:type "topojson" :feature "countries"}
           :transform [{:type "lookup"
                        :from "countries"
                        :key "country-id"
                        :fields ["id"]
                        :values ["value" "country_name" "country_code"]}
                       {:type "formula"
                        :from "countries"
                        :expr "'#/country/' + datum.country_code" :as "url"}]}
          {:name "graticule"
           :transform [{:type "graticule"}]}]})
So, the Vega interface provides quite extensive ways to inject data to the Vega component and how the component should transform, interpret and visualize the data.
Let’s spend some time with this configuration since it is the actual beef of this app.
First I inject to the map configuration the data (points, year, metric-name, min and max of the points): (defn world-schema [points year metric-name min max]. Then I transform the data points using a join (lookup) between the topojson map data and my data points using the id of the topojson data and country-id of my data points as joining the data. In this join I inject the corresponding country_name and country_code to the new data set so that I can use the country_name to provide the country name when the user hovers the mouse in certain country. I use the country_code for providing a hook when the user mouse clicks a certain country: :expr "'#/country/' + datum.country_code" :as "url"}]} and :href {:field "url" :type "nominal"} . That’s basically what you have to do - and the Vega library does the rest. Then I just show the map component in the application home page, main.cljs (injecting the re-frame subscribed data):
          {selected-metric-code :code selected-metric-name :name} @(re-frame/subscribe [::ws-state/current-metric])
          selected-year @(re-frame/subscribe [::ws-state/current-year])
          {selected-country-code :code selected-country-name :name} @(re-frame/subscribe [::ws-state/current-country])
          {:keys [points min max mean standard-deviation]} @(re-frame/subscribe [::ws-state/world-data selected-metric-code])
          metric-names @(re-frame/subscribe [::ws-state/metric-names])
          _ (if-not points (re-frame/dispatch [::ws-state/get-world-data selected-metric-code]))
          country-stats (if selected-country-code (ws-data/get-stats points selected-country-code))]
...
          [:div.column.is-9
           [oz/vega-lite (ws-data/world-schema points selected-year selected-metric-name min max) (ws-util/vega-debug)]]
Using Vega Editor
Since the map component is a bit complicated and for a Vega newcomer the transform operations are a bit hairy Vega provides excellent development tools. See the three dots icon here:

Going to Vega Editor.
Just click it and choose the Open in Vega Editor and the browser opens this for you:

Vega Editor.
You can experiment with the graphics first using the Vega editor, see the data, and check how various tunings in parameters look like in the map - and once you are happy just copy-paste the configuration back to your Clojurescript source file.
Frontend - Navigation etc.
There is very little navigation in the application. I used Reitit also to do the frontend navigation:
(def routes-dev
  ["/"
   [""
    {:name ::ws-state/home
     :view home-page
     :link-text "Home"
     :controllers
     [{:start (fn [& params] (ws-log/clog (str "Entering home page, params: " params)))
       :stop (fn [& params] (ws-log/clog (str "Leaving home page, params: " params)))}]}]
   ["country/:country-code"
    {:name ::ws-state/country
     :parameters {:path {:country-code string?}}
     :view home-page
     :link-text "country"
     :controllers
     [{:start (fn [& params] (ws-log/clog (str "Entering country, params: " params)))
       :stop (fn [& params] (ws-log/clog (str "Leaving country, params: " params)))}]}]])
Basically, the only navigation is provided when the user clicks a country - we show the year statistics of the selected metric in the line diagram. I actually spend some time with this functionality. I couldn’t figure out how to register the mouse button click event in the vega map - but I found in the documentation a way to inject a href as part of the map, so I used it: :expr "'#/country/' + datum.country_code" :as "url"}]} and :href {:field "url" :type "nominal"} - then in the frontend routing I just provide a route for this uri: ["country/:country-code", and in state.cljs:
(re-frame/reg-event-db
  ::navigated
  (fn [db [_ new-match]]
    (let [old-match (:current-route db)
          new-path (:path new-match)
          country-code (get-in new-match [:parameters :path :country-code])
          country-name (get-country-name country-code)
          controllers (rfc/apply-controllers (:controllers old-match) new-match)]
      (ws-log/clog (str "::state/navigated, new-path: " new-path))
      (ws-log/clog (str "::state/navigated, country-code: " country-code))
      (cond-> (assoc db :current-route (assoc new-match :controllers controllers))
              country-code (assoc :current-country {:code country-code :name country-name})))))
So, here we just get the country-code from the uri, find the matching country-name for it and store them into the re-frame database for further use.
The full stack app is now ready. Let’s next wrap the app into a deployment unit.
Docker Container and Heroku Deployment
I considered deploying the app to AWS but since I’m pretty stingy I didn’t want to spend my personal money on that. Then I realized that I can use Heroku Free Tier to deploy the app to the cloud (at least for the time the Heroku free dyno hours run out, or the World Bank wants to start sponsoring the app :-) ).
First I needed to create a docker container. Instructions for creating and running the Docker container (basically just testing that it works, Heroku creates the image using the heroku cli, more about it later):
just uberjardocker build -f Dockerfile . -t worldstat:latestdocker run -e PORT=9999 -it -p9999:9999 worldstat:latest
The Dockerfile is pretty minimalistic. I just create a non-root user to run the app (Heroku requires this), I copy the app and the data to the image, and provide the entrypoint to the application: run-app.sh. Notice the pretty harsh memory limits in the app (Heroku gives just max 512MB memory in the free tier).
NOTE: The application is running in the Heroku free tier and Heroku removes the application if it is not used for a certain period of time - in this case just wait patiently a few seconds and you should see the app unless the dyno hours are completely spent.
The Heroku deployment process for Docker images is pretty nicely documented here. Let’s give short instructions if you want to try it yourself:
- First build the uberjar:
just uberjar - Then basically just follow the instructions in the Heroku documentation.
- Create a Heroku account
heroku createheroku container:loginheroku container:push web -a <YOUR-HEROKU-APP-NAME>heroku container:release web -a <YOUR-HEROKU-APP-NAME>
I then changed the application name to some more descriptive: km-worldstat .
Conclusions
This exercise was really interesting. I learned quite a lot about how to experiment data using REPL in the backend. I also learned quite a lot how to create nice visualizations using the Vega library. I also learned that using Clojure and Clojurescript you can create quite powerful full stack applications without the need being a Javascript / React guru.
The writer is working at Metosin using Clojure in cloud projects. If you are interested in starting a Clojure project or getting Clojure training in Finland you can contact me by sending an email to my Metosin email address or contact me via LinkedIn.
Kari Marttila
- Kari Marttila’s Home Page in LinkedIn: https://www.linkedin.com/in/karimarttila/


Latest comments (0)