This post originally appeared on the Zeebe blog.
Designing a resilient microservices system means planning for, and alerting on various failure states. The Zeebe Cloud Canary npm package adds alerting to your Node.js Zeebe applications.
There are a few things that can go wrong in a Zeebe system that you definitely want to surface operationally. Your client applications might exception and halt. The broker might fail - whether due to a hardware failure or some edge-case condition that puts it in an infinite restart loop while recovering (it could be memory constrained, for example, and rescheduled by K8s before it can recover its state on boot up).
Both of these cases can be detected by probes. The broker has a readiness probe that can be monitored for this, and your application can have a periodic healthcheck using something like healthchecks.io.
Another case that is more subtle: when the broker is running, and your application is too - but does not have a connection to the broker. Maybe something has failed in the network. With software-defined networking, it no longer takes someone removing the cap at the end of a 10-base-T network, or unplugging a workstation in the middle of a Token Ring network to disrupt a connection.
In a development environment, for example, if you are forwarding ports to a broker in a Kubernetes cluster (maybe using bulk kubefwd), the forwarding may stop.
In this case, unless you are watching the logs, you may not notice that your application has lost its connection. It just looks like there is no work at the moment.
The Node.js client does transparent client-side retries by default, and if you don't write solid handling on the onDisconnect() handler, it will just keep trying to reconnect, and your application will report that it is alive.
Cloud Canary
I've written an npm package zeebe-cloud-canary, that deploys a canary workflow that chirps periodically. The canary worker pings a "chirp" endpoint whenever it gets the chirp task, and if it misses a chirp task by 50% of the heartbeat period, it can optionally ping a "squawk" endpoint.
If you are using healthchecks.io, then you don't need a squawk endpoint, because healthchecks.io can be configured to alert you after a missing ping.
In the initial implementation of this, I created a single, long-running workflow instance for the canary. This is problematic, because the workflow events are not reaped until the workflow completes. This causes disk space usage to increase over time, and broker recovery takes longer when a node is restarted (which can lead to those rebooting loops).
The new implementation starts a new workflow instance for each chirp, from the canary worker that chirps. Message correlation is used to make sure that you get only a single chirp, and not a chorus of tweets.
You can use this across multiple workers to prove that you have at least worker / application connected for the class.
Installing
To install the package to your application:
npm i zeebe-cloud-canary
Usage
Then in your application code, create a canary:
import { ZeebeCanary } from 'zeebe-cloud-canary';

// Uses the zeebe-node zero-conf constructor, either localhost or from ENV
const canary = new ZeebeCanary({
    ChirpUrl: `${healthchecks_io_url}`,
    CanaryId: 'some-canary-id',
    HeartbeatPeriodSeconds: 300
})
See the README for more configuration options, and take a look at the canary source code (it's just 108 lines).
The canary uses micromustache to template the CanaryId into the bpmn before deploying it (code here, bpmn example here), allowing you to namespace the canary by application, worker, application instance, worker instance, or any other resolution that makes sense.
At the moment, I'm using it per-application instance. My applications have multiple workers in them, so my hypothesis here is that as long as the application instance canary has connectivity, all the workers in the application have a connection.
To prevent race conditions, (for example, you name-space by application and spin up multiple instances at different times), when a worker services the chirp, it publishes a message to cancel any other instances of its name-spaced canary workflow, before starting another one.
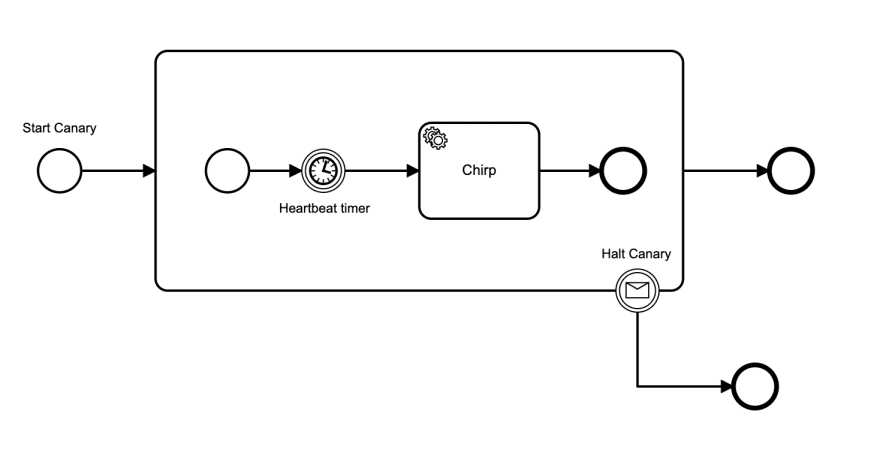
Here is the bpm diagram:
Summary
This is one idea for operational monitoring, using message correlation, and templating of a generic workflow. There are many ways that you can do it, and exactly what you monitor and how you do it depends on your tech stack and your potential failure modes.
Note that you can't open the workflow in the Zeebe modeller - the process id with the template string in it doesn't validate. To create it, I edited the bpmn file in Visual Code after creating it in the modeller.


Oldest comments (0)