
Table of content
A Lesson from History
Have you ever felt like you just needed another “You” to get everything done in time? That’s how we, at Carnot, felt when our customer base increased at a rate, way beyond our expectation. It was like taking on a sea swimming challenge just after finishing your first lessons with floaters.
For the backend team, it meant having to support 20 times more traffic without impacting customer experience in any way. It was a challenge, and it did not help the fact that our entire backend team consisted of only three people. But you know what they say — “No pressure, no diamonds!”
We learned a lot of empowering lessons from those demanding times. One such lesson was — Auto Scaling, which is arguably the most important cloud management tool.
The Why
In the early days, when we knew little about handling traffic peaks, we had a monolithic architecture. A socket server would allow our IoT devices to connect & send data, which was then queued in a Redis cache until it got processed by our main server.

As our clients increased, the entire cloud pipeline was affected by the slowest component. The Redis cache which was used only for queuing soon had a large queue and ran out of memory.
At that time, not upgrading the cache for better memory specification would have meant losing valuable customer data. Hence, we selected the Redis plan so as to support data retention in the queue even during the peak traffic time.
The system was stable with this. The only problem was that we were paying a lot more than what we were utilizing. On deeper analysis, we found that the so-called “peak traffic” would occur only during certain hours of the day. 75% of the time, the extra memory opted, was unused. But we were still paying for it.
Our top reasons to have a system - an auto-scaling feature on all our Redis instances were:
- Dynamic Load Management - Helps to cater to the dynamic load on your application. Scales in accordance to the load & demand.
- Avoid Data Drop - Helps to ensure timely scaling to avoid redis data drop. Scales prematurely by monitoring key metrics and mitigates data drop of new incoming information
- Avoid Downtime - Helps to avoid downtime on your application. Monitors key metrics to ensure your redis is always accessible.
- Cost Saving - Finally, saves cost by scaling down in low-load scenarios
The What
Frankly, “auto-scaling” was a buzz word for us at that time. We had read a lot about it and understood that it helps to automatically detect your traffic & scale your cloud components. We knew that we absolutely needed this. But we could not find an easy plug and play solution for our scenario — Redis scaling on the Heroku platform.
So, we decided to do what we do best at Carnot — Start from basics and build your own in-house system
What we needed was a mechanism to
- Monitor the key metrics for Redis health check
- Detect incoming traffic (or load) on servers
- Create a cost-function to get the cheapest possible plan for current traffic
- Change the plan as detected by the cost-function
Well, that’s what we built for one Redis, then the other and another; until we created a standalone plug-and-play solution of our own — for any Redis on Heroku.
The How
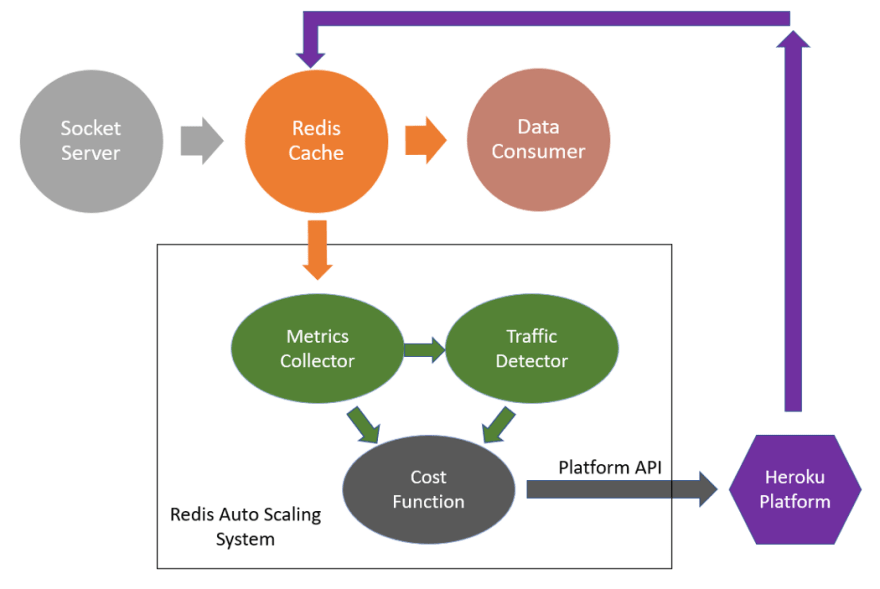
To monitor the Redis health, we selected two most critical metrics:
- Memory consumption
- Clients connected
We designed a metric collector that would connect to the concerned Redis and collect these metrics periodically using INFO command. The frequency of metrics collection was kept configurable (with minimum of 30 sec) and could be selected as per the expected rate of traffic change. The metric collector would store these metrics in a connected database.
We also pre-defined scaling thresholds for the Redis that needed monitoring & scaling. The traffic detector would actually store these thresholds in database and would compare the metrics collected by metric collector against the thresholds to decide whether scaling was needed. Example - if a threshold of 80% is set on memory consumption, and current consumed memory has been above 80% for a while, "scale-up" decision would be given.
For our cost function, we had all the available Redis plans stored in database along with details like maximum offered memory, maximum offered client connections, cost, etc. To save cost, we needed to scale down the Redis without causing too frequent back-to-back "scale-up", "scale-down" decisions. This is why we added
- Certain wait period between consecutive scaling decisions
- Additional buffer on top of configured threshold for "scale-down" decision
- Check of memory consumption percentage on the lower plan before deciding to "scale-down"
Example - if a threshold of 80% is set on memory consumption, and the current consumed memory has been less than 75% of the memory offered by lower plan, "scale-down" action was decided.
The actual scaling was done using stored details of the Redis and the Heroku Platform APIs.
We have made this entire system open source. If you are facing a similar issue, feel free to set it up in your account and share your experience. Any issues/suggestions to improve the system are most welcome.
Setup Guide
Follow below guidelines to quickly set this auto scaling module on your heroku account.
Heroku application
![]()
Environment Configuration
-
HEROKU_API_KEY: API key for your heroku account -
EMAIL_HOST: Host name for your email -
EMAIL_PORT: Port for your email -
EMAIL_HOST_PASSWORD: Host password -
EMAIL_HOST_USER: Host username -
SERVER_EMAIL: Server email -
RECIPIENTS: Comma separated emails of notification recipients -
ENABLE_EMAILS: A global flag to enable / disable all types of mails -
EMAIL_PREFIX: Email subject prefix for possible filter addition -
N_RETENTION_DAYS: Number of days to retain metrics logs
Initialize
Post deployment initialize.sh is run from console.
This does 3 things:
- Applies all DB migrations
- Creates superuser for django admin panel
- Adds static info to database
Redis Configuration
Run python add_redis_mon.py from console
This will prompt you for all information related to redis instance for which auto scaling needs to be enabled.
General Configuration
-
Name: An identifier name for your redis insatnce. Can be alphanumeric -
Heroku App Name: This is the name of heroku application to which your redis instance is attached -
Redis Heroku Name: This is the URL name by which your heroku application identifies the redis. (Example: REDISCLOUD_ORANGE_URL or HEROKU_REDIS_BLANK_URL)
Metrics Configuration
-
Metric Rate: Choose rate of metrics collection from given options. Select a faster rate only if your application demands a quick action. -
Avg memory percentage: Choose the avg memory usage percentage you wish to maintain for you redis instance -
Avg connection percentage: Choose the avg number of client connections you wish to maintain with the redis instance
Scaling Configuration
-
Scaling Enable- If set, auto scaling action would be taken to maintain the avg metric percentages -
Min Plan- Choose lower plan limit for scaling. If not set, lowest available plan will be selected -
Max Plan- Choose upper plan limit for scaling. If not set, highest available plan will be selected -
Scaling Rate- Choose rate at which scaling check should be performed
Notification Configuration
-
Threshold Breach- Email notification to configured recipients whenever any threshold is crossed -
Scaling Success- Email notification whenever a successful scaling action is performed -
Scaling Failure- Email notification whenever there is a failure in scaling action
To setup the project locally, follow this reference guide
The Learnings
While working so much with Redis caching, queuing and more specifically with Redis auto-scaling, we realized that Redis Cloud was the best suited solution for our used case.
With other service providers we observed one of these problems:
- Slowed plan update - the upgrade or downgrade of Redis plan would take a long time to execute compared to what our application could tolerate. This used to make Redis unreachable during command execution and would cause bottlenecks in our pipelines.
- Redis URL change - with some service providers, the Redis URL (creds) would change, and this would impact some of our internal applications that had used URL to connect to Redis. The Redis would not be accessible to these applications causing them to crash.
- Cost - many of the service providers that offered faster plan update were expensive
Overall, we found that Redis service by Redis Cloud would scale quickly while maintaining all the data. We ended up migrating all our caches to Redis Cloud
Life After

After sugar, spice & everything nice and an accidental chemical X, we are now capable of supporting over a million IoT nodes. We have definitely come a long way from those early times and learned a lot along the way.
As we grew, most of our systems moved away from Heroku (to AWS) in order to save costs. But, for any start-ups/developers out there who are dealing with around thousand client nodes and use Heroku as their preferred choice of platform (for its obvious ease of set-up), we hope this blog would be helpful.
We are trying to fix some broken benches in the Indian agriculture ecosystem through technology, to improve farmers’ income. If you share the same passion join us in the pursuit, or simply drop us a line on report@carnot.co.in
This post is in collaboration with Redis.
Learn more:


Oldest comments (0)