
I was delighted when the brilliantly creative Naomi Scott reached out this summer asking if I'd like to collaborate on a project. In her past life at Beggars Group (home of Rough Trade, Matador Records and 4AD) we made interactive sites for phenomenal rock acts including The Breeders, Stephen Malkmus and Parquet Courts. These sites always end up being just as fun to create as they are to use, so I was thrilled to get to work on a new one.
The Brief
Naomi asked about the feasibility of building a site that created personalized, shareable weather forecasts to celebrate Homeshake's new album, aptly titled UNDER THE WEATHER. The pitch was to create an experience that would select a song from the album to perfectly pair with your local weather conditions—a somber track if it's raining, something a little more uptempo on a nice day—with the ability to share a graphic of your forecast and song to Twitter and Facebook. The client also requested integration with Spotify to allow visitors to save their recommended track directly to their streaming library.

It's chilly out. Stay in with some tunes
At my day job at Ralph Creative, we're often asked by clients to build generators that dynamically produce images with personalized elements for visitors to share. Spotify integration was also familiar territory, as many sites I've worked on with Naomi involved creating custom playlists (like our vast Matador Decade site). Extrapolating weather data from a visitor was new ground for me, but I love a challenge! Naomi got cracking on designing the look & feel of the site, and I scaffolded a new Vue.js project—my preferred front-end framework—to begin experimenting and building.
Locating Visitors
After some research, I settled on using the OpenWeather API, which has a free plan that offers a very generous 1 million calls per month. But first, I needed a way to determine the visitor's location and alternatively allow them to get forecasts for anywhere in the world. The right solution ended up being a combination of three free APIs: OpenWeather, FreeGeoIP and Google Maps.
As OpenWeather doesn't have its own geolocation feature, a good alternative was to ping FreeGeoIP on pageload via AJAX. Their free API allows 15,000 requests per hour and provides plenty of useful information that gives us a best guess at the visitor's location, including city, state and country names, as well as latitude/longitude coordinates (which we could then pass to OpenWeather to ensure accuracy).
axios
  .get("https://freegeoip.app/json/")
  .then(response => {
    this.city = [response.data.city, response.data.region_code]
      .join(", ");
    this.coords.lat = response.data.latitude;
    this.coords.lon = response.data.longitude;
  });
However, we didn't want to force visitors to only get a forecast for the location we determined for their IP—there's always a chance it could be inaccurate, and we thought people might enjoy seeing what songs would be suggested for other cities and parts of the world.
It was quickly apparent that OpenWeather's text query functionality was a bit hit-or-miss, which was all the more reason to find a solution that let us send over coordinates rather than place names. For this, I ended up going with a familiar and intuitive component: the Google Maps Place Autocomplete API. This would allow visitors to type a partial name of anywhere in the world, select a result, and then provide us coordinates to feed to OpenWeather.
Generating the Forecast
Armed with latitude/longitude coordinates, I send an AJAX request to OpenWeather and receive back a wealth of information about the location: the current day, time and timezone (important, since the chosen location could be on the opposite side of the world), and a few other interesting pieces of information: a description of the weather, the "feels like" temperature, and the wind speed. Then I massage the data a bit: convert Celsius to Fahrenheit for applicable countries, round the temperatures to whole numbers, and use the Beaufort Wind Scale to get a brief description of the wind conditions ("light breeze", "storm", etc) based on the speed converted to knots.
At this point, we just needed a way to pair the current weather conditions to one of the album's songs. While Spotify does offer some fascinating audio features through their API including danceability, energy and tempo, we felt a more human touch would help here since we were only dealing with twelve tracks. Naomi was able to assign unique weather scenarios to each song based on the mood of the track, and provided me a list (seen below) to adapt using OpenWeather's condition codes.
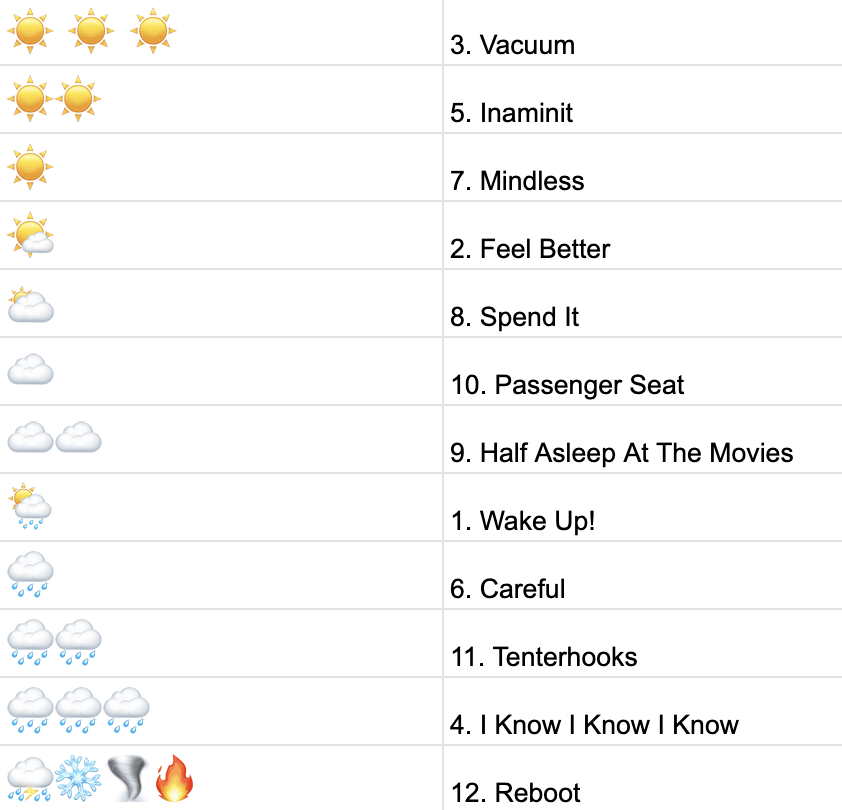
We used a very scientific emoji scale for weather conditions
Making it Shareable
One of the best-case scenarios for this type of shareable-producing site is to generate a spark of viral activity that leads more people to the experience. To create a path of least resistance, it's best to make sharing simple by incorporating direct links to publish personalized results to Twitter and Facebook.
To pull this off, I implemented a backend to create and store the images; a tried-and-true stack of PHP with ImageMagick to craft customized PNG images for each forecast, and MySQL to store the corresponding short URLs. These short URLs serve two main purposes: they have Open Graph meta tags that instruct social networks to render the corresponding custom images (1200x630px PNGs), and they redirect incoming traffic to the homepage so new visitors can start the experience from scratch.

A tweet that was automatically populated by the site's share buttons
Adding Polish
When Naomi and I are building sites around new album releases, we aim to capture the feel of the album's aesthetic—taking inspiration from cover artwork and music videos when possible—and bring it to life. The sketchy look of UNDER THE WEATHER's front cover and cloudy look of its inner jacket were perfect to adapt to the site.
Knowing that Naomi would be designing graphics to represent each possible weather condition, I suggested trying a line boil-style animation, wherein each element is drawn multiple times to provide subtle life to otherwise static lines. We think the result ended up having a lot of personality!

Animations on a loading screen
Wrap-Up
I really enjoyed getting to combine the concepts of real-life weather conditions and music recommendations into one custom build for a great artist. This site had the added bonus of getting to search Twitter after to see visitors sharing their forecasts. As of this blog, we've generated over 2,000 forecasts and counting!
Please give the site a try at homeshake.net/forecast. ☀️


Top comments (0)