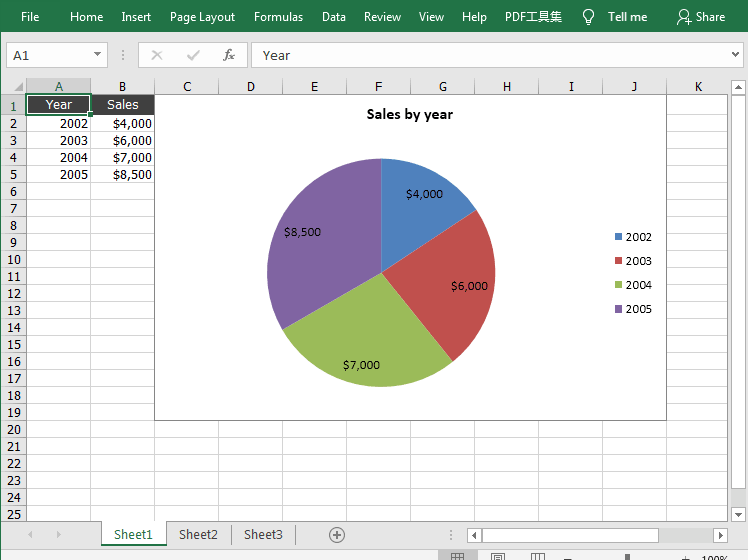
A pie chart is a circle with small sectors that is often used to show the portions of a total percentage. It can present and compare data in an easily-understood way, which enables us to have an immediate analysis or quick understanding of the data information in the Excel.
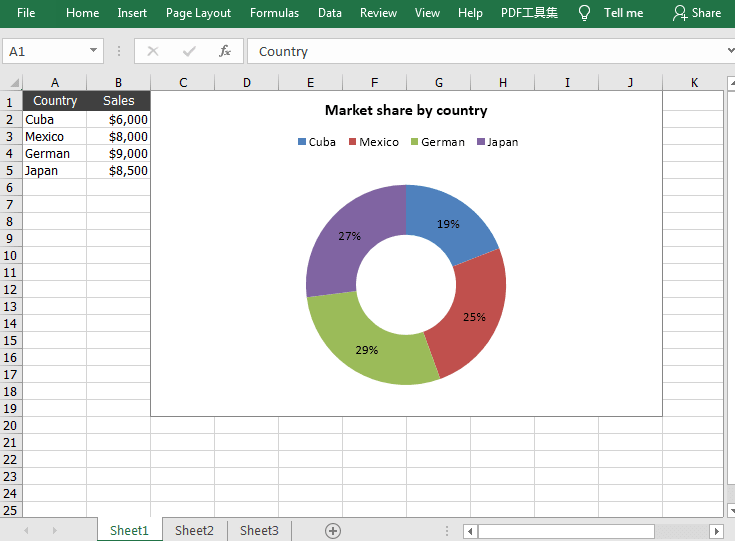
As for the doughnut chart, it performs the same function as a pie chart does, except that it has a hole in the center.
This article will share how to create a pie chart and a doughnut chart in Excel document by using Free Spire.XLS for Java.
Installation
Method 1: Download the Free Spire.XLS for Java and unzip it.Then add the Spire.Xls.jar file to your project as dependency.
Method 2: You can also add the jar dependency to maven project by adding the following configurations to the pom.xml.
<repositories>
        <repository>
            <id>com.e-iceblue</id>
            <name>e-iceblue</name>
            <url>http://repo.e-iceblue.com/nexus/content/groups/public/</url>
        </repository>
</repositories>
<dependencies>
    <dependency>
        <groupId>e-iceblue</groupId>
        <artifactId>spire.xls.free</artifactId>
        <version>2.2.0</version>
    </dependency>
</dependencies>
Pie Chart:
import com.spire.xls.*;
import com.spire.xls.charts.ChartSerie;

import java.awt.*;

public class CreatePieChart {

    public static void main(String[] args) {

        //Create a Workbook object
        Workbook workbook = new Workbook();

        //Get the first sheet
        Worksheet sheet = workbook.getWorksheets().get(0);

        //Insert data
        sheet.getCellRange("A1").setValue("Year");
        sheet.getCellRange("A2").setValue("2002");
        sheet.getCellRange("A3").setValue("2003");
        sheet.getCellRange("A4").setValue("2004");
        sheet.getCellRange("A5").setValue("2005");

        sheet.getCellRange("B1").setValue("Sales");
        sheet.getCellRange("B2").setNumberValue(4000);
        sheet.getCellRange("B3").setNumberValue(6000);
        sheet.getCellRange("B4").setNumberValue(7000);
        sheet.getCellRange("B5").setNumberValue(8500);

        //Set cell style
        sheet.getCellRange("A1:B1").setRowHeight(15);
        sheet.getCellRange("A1:B1").getCellStyle().setColor(Color.darkGray);
        sheet.getCellRange("A1:B1").getCellStyle().getExcelFont().setColor(Color.white);
        sheet.getCellRange("A1:B1").getCellStyle().setVerticalAlignment(VerticalAlignType.Center);
        sheet.getCellRange("A1:B1").getCellStyle().setHorizontalAlignment(HorizontalAlignType.Center);
        sheet.getCellRange("B2:C5").getCellStyle().setNumberFormat("\"$\"#,##0");

        //Add a pie chart to the sheet
        Chart chart = sheet.getCharts().add(ExcelChartType.Pie);

        //Set data range of chart
        chart.setDataRange(sheet.getCellRange("B2:B5"));
        chart.setSeriesDataFromRange(false);

        //Set position of the chart
        chart.setLeftColumn(3);
        chart.setTopRow(1);
        chart.setRightColumn(11);
        chart.setBottomRow(20);

        //Set chart title
        chart.setChartTitle("Sales by year");
        chart.getChartTitleArea().isBold(true);
        chart.getChartTitleArea().setSize(12);

        //Set series data label
        ChartSerie cs = chart.getSeries().get(0);
        cs.setCategoryLabels(sheet.getCellRange("A2:A5"));
        cs.setValues(sheet.getCellRange("B2:B5"));
        cs.getDataPoints().getDefaultDataPoint().getDataLabels().hasValue(true);
        chart.getPlotArea().getFill().setVisible(false);

        //Save the document
        workbook.saveToFile("PieChart.xlsx", ExcelVersion.Version2016);
    }
}
Doughnut Chart:
import com.spire.xls.*;
import com.spire.xls.charts.ChartSerie;
import com.spire.xls.charts.ChartSeries;

import java.awt.*;

public class CreateDoughnutChart {

    public static void main(String[] args) {

        //Create a Workbook object
        Workbook workbook = new Workbook();

        //Get the first sheet
        Worksheet sheet = workbook.getWorksheets().get(0);

        //insert data
        sheet.getCellRange("A1").setValue("Country");
        sheet.getCellRange("A2").setValue("Cuba");
        sheet.getCellRange("A3").setValue("Mexico");
        sheet.getCellRange("A4").setValue("German");
        sheet.getCellRange("A5").setValue("Japan");


        sheet.getCellRange("B1").setValue("Sales");
        sheet.getCellRange("B2").setNumberValue(6000);
        sheet.getCellRange("B3").setNumberValue(8000);
        sheet.getCellRange("B4").setNumberValue(9000);
        sheet.getCellRange("B5").setNumberValue(8500);

        //Set cell style
        sheet.getCellRange("A1:B1").setRowHeight(15);
        sheet.getCellRange("A1:B1").getCellStyle().setColor(Color.darkGray);
        sheet.getCellRange("A1:B1").getCellStyle().getExcelFont().setColor(Color.white);
        sheet.getCellRange("A1:B1").getCellStyle().setVerticalAlignment(VerticalAlignType.Center);
        sheet.getCellRange("A1:B1").getCellStyle().setHorizontalAlignment(HorizontalAlignType.Center);
        sheet.getCellRange("B2:C5").getCellStyle().setNumberFormat("\"$\"#,##0");

        //Add a pie chart to the sheet
        Chart chart = sheet.getCharts().add(ExcelChartType.Doughnut);

        //Set data range of chart
        chart.setDataRange(sheet.getCellRange("A1:B5"));
        chart.setSeriesDataFromRange(false);

        //Set position of the chart
        chart.setLeftColumn(3);
        chart.setTopRow(1);
        chart.setRightColumn(11);
        chart.setBottomRow(20);

        //Set chart title
        chart.setChartTitle("Market share by country");
        chart.getChartTitleArea().isBold(true);
        chart.getChartTitleArea().setSize(12);

        //Set series color
        ChartSeries series = chart.getSeries();
        for (int i = 0 ; i < series.size() ; i++) {
            ChartSerie cs = series.get(i);
            cs.getDataPoints().getDefaultDataPoint().getDataLabels().hasPercentage(true);
        }

        //Set legend position
        chart.getLegend().setPosition(LegendPositionType.Top);

        //Save the document
        workbook.saveToFile("DoughnutChart.xlsx", ExcelVersion.Version2016);
    }
}


Top comments (0)