A couple weeks ago I learned that Google Image Charts is shutting down, leaving a lot of people in the lurch. Although the API has been deprecated for many years, many developers had not made the switch.
Why do Image Charts matter? There are plenty of graphing libraries like Chart.js, plotly, d3, and so on. The difference is that these libraries require Javascript, but Image Charts are necessary for embeddable, non-Javascript environments such as email, SMS, and certain types of reports.
This post describes the process of creating an open source image chart offering called QuickChart.
If you don't want to read the whole thing, skip to the final result: the image chart web service (called QuickChart) and source code.
Step 1: What's the best way to define a chart?
The old Google Image Charts API was arcane, built for a time when browsers couldn't support long URLs.
This meant that you had to sacrifice readability and also learn a custom format. For example, the following URL:
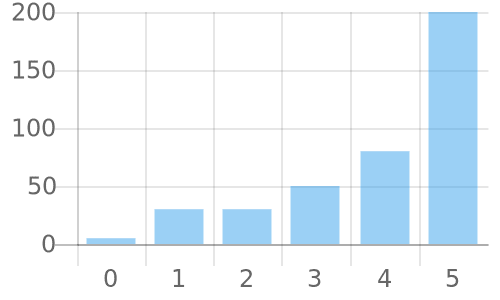
https://chart.googleapis.com/chart?cht=bvg&chs=250x150&chd=t:5,30,30,50,80,200&chxt=x,y&chxs=0,ff0000,12,0,lt|1,0000ff,10,1,lt
Produces this graph:

It gets more complicated from here. The API supported a "simple encoding format" that allowed users to encode integer values between 0 and 61 as single characters. Characters A-Z would encode integers 0 through 25, a-z encodes 26 through 51, and the digits 0-9 encode the remaining values through 61. You'd wind up with URLs like ?chd=s:BTb19_,Mn5tzb that encode a handful of two-digit numbers.
There is an "extended encoding format" that include punctuation. For example, -. is equivalent to the number 4,031. Easy, right?
I decided this was bad. Imagine coming across this URL in code and trying to figure out what it meant. Imagine writing your own number encoding script, only to find that your data contains a number larger than 61 and having to rewrite your encoder.
The Image Charts API was built in the early 2000s. Nowadays browsers can do much better. For this reason I decided to use Chart.js as inspiration. Chart.js is very popular and has a clear API for defining charts:
{
  type: 'bar',
  data: {
    labels: [0,1,2,3,4,5],
    datasets: [{
      data: [5,30,30,50,80,200]
    }]
  }
}
Step 2: Putting it together
We're using Chart.js, but that library produces charts dynamically via Javascript instead of images. That's a showstopper because most users will want to embed static images in email.
The good news is that Chart.js uses HTML5 Canvas, and canvas can be converted into an image.
The invention of Node made it much easier to run Javascript on the server side. A server side canvas implementation called node-canvas followed. I evaluated a couple server-side Chart.js wrapper that used node-canvas to render the image and settled on chartjs-node-canvas with some modifications to make it more memory efficient.
This meant that I could take a Chart.js config like the one above and render it on the server side.
Step 3: Building the web service
The web service is fairly straightforward. It's just an express app that hooks into my patched chartjs-node-canvas library.
Upon implementation, I realized there were some default Chart.js options that I would like to apply. For example, line and bar chart axes should start at 0 by default. I also added a nice color palette and a Chart.js plugin that added the option for data labels.
The result is a single endpoint, https://quickchart.io/chart?c=, that takes a Chart.js configuration and renders it as a PNG image.
Let's take our simple chart JSON above and send it into the endpoint:
This URL loads the following image:
Perfect!
Step 4: Getting more creative
It's relatively straightforward to build customized charts based on the Chart.js documentation:

At this point we're limited only by the Chart.js API, which is very flexible.
This chart uses custom background colors, title styling, legend position, stacked series, axes labels, and data labels:
{
  type: 'bar',
  data: {
    labels: ['January', 'February', 'March', 'April', 'May'],
    datasets: [{
      label: 'Dogs',
      backgroundColor: 'chartreuse',
      data: [ 50, 60, 70, 180, 190 ]
    }, {
      label: 'Cats',
      backgroundColor: 'gold',
      data: [ 100, 200, 300, 400, 500 ]
    }]
  },
  options: {
    title: {
      display: true,
      text: 'Total Revenue (billions)',
      fontColor: 'hotpink',
      fontSize: 24,
    },
    legend: {
      position: 'bottom',
    },
    scales: {
      xAxes: [{stacked: true}],
      yAxes: [{stacked: true}],
    },
    plugins: {
      datalabels: {
        display: true,
        font: {
          style: 'bold',
        },
      },
    },
  },
}
That's quite a bit more JSON than our simple example, but the specification is well-documented and uses a widespread standard. Note that for more complex configurations, we need to URL-encode the JSON object before passing it to the API (e.g. by using Javascript's encodeURIComponent).
We can also use any of the chart types provided by Chart.js. For example:
The above URL yields:

Step 5: Making it open source
I named this web service QuickChart and put it online at QuickChart.io. It's very cheap to run so I've made the image chart generation service available for free with no limitations.
Separately, I've open-sourced the project over on Github. I would welcome involvement and contributions from the rest of the community!
Here are some thoughts on where we can take this project:
- Create a library of useful chart templates
- Create a "short url" feature that maps complex configurations to a simple URL
- Support other kinds of charts - perhaps even maps or other more advanced visualizations
This is a strong base for a flexible and reliable image chart generation service.
There are lots of possibilities and I'm excited to continue building!


Top comments (1)
I am surprised that this open-source project does not come up on top in Google when searching for image charts.