Over the past year-and-a-half we’ve worked hard with our team of 10 on an open-source project called Objectiv, to:
- Collect product analytics data in a super-structured format, with awesome developer tooling; and
- Analyze that very structured data quickly in a regular notebook, by taking pre-built data models or building your own, and optionally share the analyses in other tools such as BI.
We power the modeling part with a library that has a Pandas-like interface (called Bach), and that translates all operations to SQL running straight on any SQL data store.
Why we started this project
We’ve worked a lot on both sides of product analytics; as developers, and as data scientists. And we always ran into the same issues:
- As a front-end developer, tracking instrumentation tools are not helpful in collecting the right data. Every datapoint is a custom implementation, and there’s no documentation or linting in your IDE to help track the correct properties & types. Maybe there’s a tracking plan in a big Excel spreadsheet, but it’s likely incomplete & outdated. And as soon as the data team starts working with the resulting data, they continuously request changes/additions for use cases they didn’t think of upfront, meaning you go back-and-forth on the implementation all the time.
- As a data scientist, you have to first spend the majority of your time on cleaning, prepping and transforming the data, before you can get to actual modeling. And you have to repeat this loop for every app and modeling use case, because everyone re-invents their own data format. Which means you also can’t share & reuse data models with others. And then once you’re done, you still need to translate your model to a production-ready version.
The key issue here is that there are lots of great tools to do either data collection or modeling, but there’s nothing that actually connects the two.
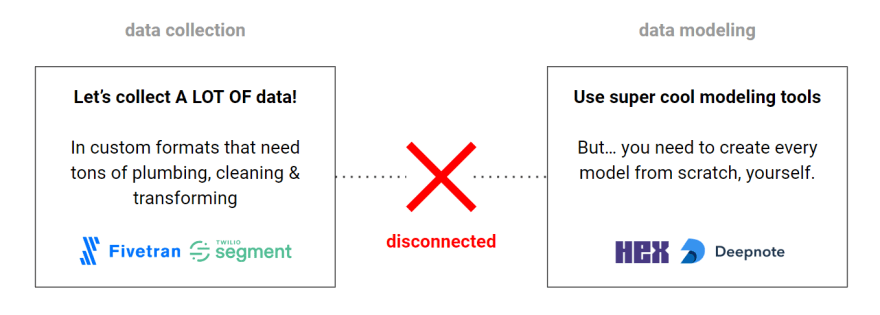
What we built to try to fix this
A set of tightly integrated tools, to bridge that disconnect between data collection and modeling:
- An open data format that fits any product UI & analytics modeling use-case.
- Tracker SDKs for modern frameworks, with awesome dev support.
- An 'open model hub': a python library with a collection of pre-built data models.
- Bach: a python library that runs the models & operations directly on any data store.
More details on each of these below.
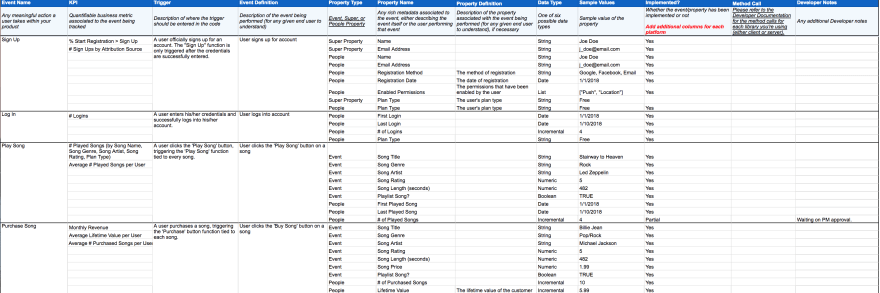
1) An open data format that fits any product UI & modeling use-case
We call this the open analytics taxonomy, and we invite anyone to contribute to it.
It’s an attempt to create a universal, generic structure for analytics data. So far we worked with the data and analytics use cases of more than 50 companies to define it, and made sure that it covered it all. Of course it’s also extensible for any custom use cases.
One thing we also addressed with the taxonomy, is knowing where an event exactly happened in the UI, because nearly every data question starts with that. We call this 'UI awareness'. For instance, let’s say you have a website with a main section, and within that a button; when you press the button, that exact UI hierarchy is captured in a so-called LocationContext. This way a data scientist can always relate events back to where they happened in the UI, even when it changes over time.
See a small part of the taxonomy in the screenshot below:

For modeling, using this taxonomy enables you to reuse models and share them with others, even across different datasets, and externally across different companies, because everyone is using the same format. But more about that later.
2) Tracker SDKs for modern frameworks, with awesome dev support
We’ve tried to make a front-end dev’s life as easy as possible.
We currently have SDKs for React, React Native, Angular, and also plain JavaScript. Full Vue and Next.js SDKs are coming up soon, and more are on our list. We aim to have an SDK for every popular framework/platform, so instrumentation is perfectly tailored to each.
For instrumentation, the taxonomy prescribes exactly what to track & how, so you don’t need a tracking plan. You can just swap any component or HTML element in your app with its Objectiv counterpart that comes with the SDK (e.g. a TrackedButton for a button), or if you have your own components, you can wrap them. That will automatically track everything, with all the required data and UI location.
Your own components that you’ve added tracking to can also be easily reused anywhere in your application. The SDK will apply the UI location and track it automatically.
Next to this, there are several tools to assist with validation against the taxonomy before it ends up in a database, see below.
Validation: in the IDE
All of the SDK components come with TypeScript definitions, so you’ll get inline documentation about each component. You also get linting for any issues, for instance to ensure that you use the right fields for a component, and the right data types.

Validation: in the application, to ensure UI awareness
Let’s say you add two buttons with the same text & link on a screen, but don’t have any tracking for the section they’re in. This means they wouldn’t actually be uniquely distinguishable in the data by the data scientist (which they’ll probably chase you about later on :)).
So: we warn you about this upfront, in the browser console, when the page loads (on registering the component).

To fix this, the SDK makes it easy to track the section the buttons are in, so they’re unique.
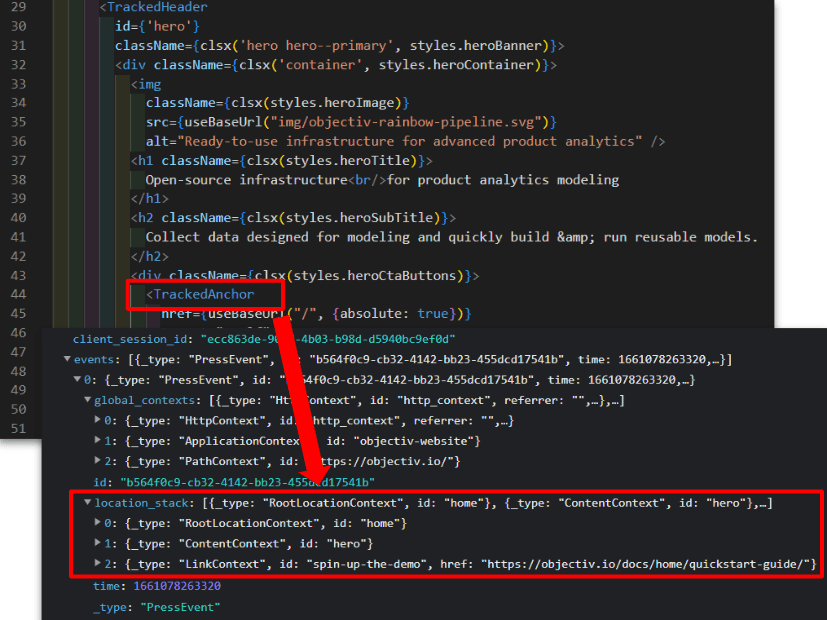
Validation: in the application, to ensure the right data is tracked
Even if you have a custom tracking case, you’re still not on your own: you get the same validation tools as with the regular SDK. For instance, if you don’t apply the right data, you get a warning like below in the browser console.
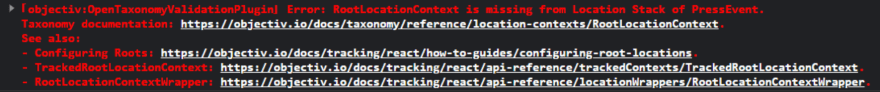
The messages are very descriptive. Here it’s saying that the RootLocationContext is missing from the Location Stack of this PressEvent, with a link to background documentation. This is actually one of the key data points, capturing the top-level UI location where this event happened, e.g. the homepage. Next to that, there are links to documentation specific for your platform (in this case React) that actually tell you how to fix this issue.
These types of messages are triggered for any data this is missing, duplicate, or redundant.
Validation: end-to-end testing with snapshots
Once you have your tracking in place, you want to make sure it doesn’t break as you develop your app. To do that, our SDKs support testing with any CI-framework you already have in place that uses snapshots. For instance, we use Cypress for our website, and the screenshot below shows one of our tests.
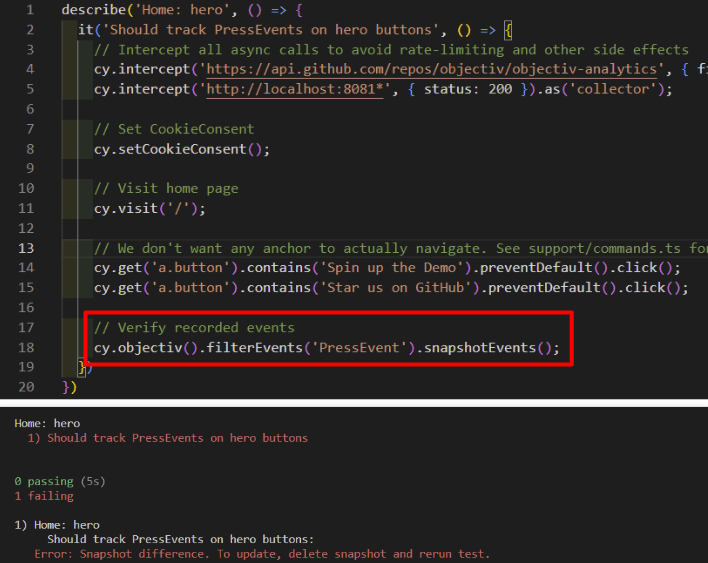
To add testing of the tracking instrumentation, we just needed to add the one line that is highlighted. It compares the resulting tracking output with what’s in the snapshot, which is generated the first time you run the test. So now if your tracking changes, and you run this test, it will fail on any tracking regressions, and any new issues you may have introduced, such as new collisions.
You can run this locally while developing, or in CI. We’re running our tests with a GitHub Action on every push for instance.
For a backend: use Snowplow or Postgres
We’ve also thought about Ops :-). There’s a backend 'Collector' that stores data in Postgres, for instance to use while developing locally, or if you want to get set up quickly. But there’s also full integration with Snowplow, which works seamlessly with an existing Snowplow setup as well.
3) An ‘open model hub’: a python library with a collection of pre-built data models
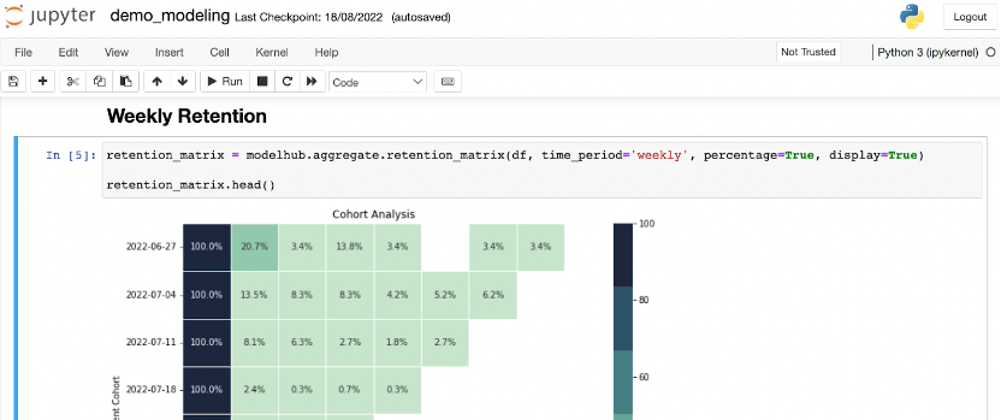
For every product or project, we generally run many of the same analyses, which we have to build from scratch: user count, retention, session duration, etcetera. To make this a lot easier, we built a python library with a collection of pre-built data models that you can just take off the shelf, such as a retention matrix, funnel discovery, logistic regression, etc. Check out the current (and growing) list of models here.
We call this the open model hub, and just like with the taxonomy, we invite anyone to contribute to it, so it can cover everyone’s analytics use cases.
# show a retention matrix, monthly, with percentages
retention_matrix = modelhub.aggregate.retention_matrix(
    df,
    time_period='monthly',
    percentage=True,
    display=True)
retention_matrix.head()
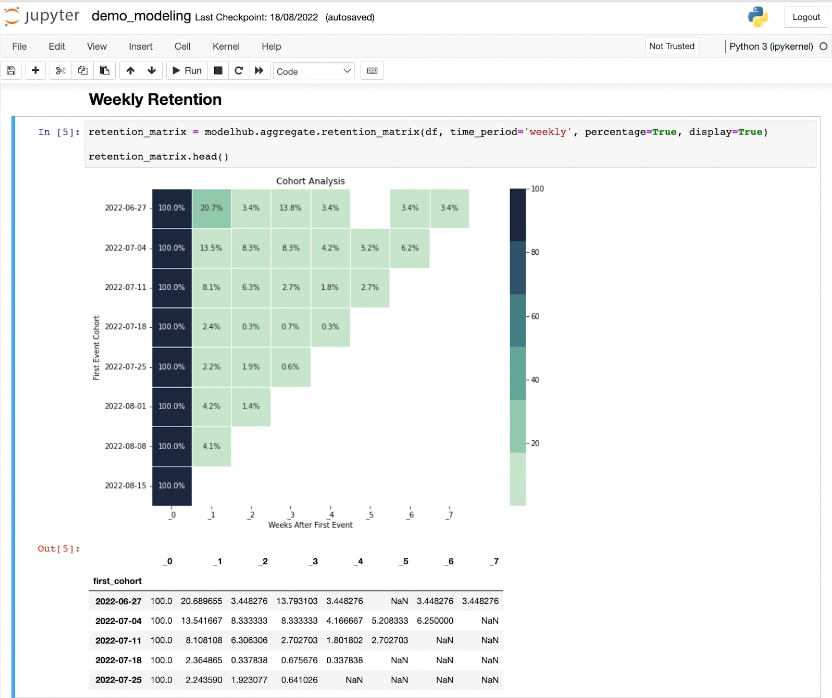
By collecting data according to the open analytics taxonomy, you can reuse your models and share them with others; you can even share models across different datasets, and externally, across different companies.
4) Bach: a python library that runs the models & operations directly on any data store
The last piece is a python library called Bach that lets you build data models on any dataset, just like you would with Pandas. The difference is that, under the hood, every operation is translated to SQL that runs directly on the data store, so you work on the full dataset (though you can also switch between that and a sample with one command).
# generate descriptive statistics of a DataFrame
# directly queries the database
df.describe(include='all').head()
We kept its interface nearly the same as Pandas, so there’s almost no learning curve. On top of that it has some added operations to make it easy to work with data that’s collected according to the open analytics taxonomy, e.g. creating a specific DataFrame from the database.
Because it translates everything to SQL, once you’re done building a model, getting it to production is just a matter of exporting the resulting SQL to any solution, such as dbt, a BI tool like Metabase, etc. As the models are built directly on the full dataset, you can be sure it runs the same in production as well.

The goal with Bach is to be 100% data store agnostic, so you can seamlessly switch any model you’ve built to another database. Currently we support PostgreSQL, Google BigQuery, and (very soon) Amazon Athena. Next up are Databricks, RedShift, Clickhouse, etc.
Where we want to go with the project
Our dream is to have a community of devs & data scientists around the project, who contribute to the open analytics taxonomy and to the models, so it covers any product analytics use case - from product analytics to a/b testing, payments, personalisation, etc.
Ultimately, we want to make the lives of both devs and data scientists (and so our own lives :)) easier, and be able to spend more time on the things they enjoy.
Check it out and give us a star :)
Hope you like it. Check out the project on GitHub, and please do give us a star so others can find us too! https://github.com/objectiv/objectiv-analytics


Top comments (0)