
"Data is a precious thing and will last longer than the systems themselves" ~ Tim Berners Lee
1. An Internal Email to Tim Cook and the State of Business Intelligence
 We get a glimpse into the inner workings of a valuable company and it turns out it's not all sunshine and rainbows.
2. Equivalence Class Partitioning And Boundary Value Analysis in Black Box Testing
 1. What is black box testing
3. Washington, D.C. gives no fucks
 It’s summer in our nation’s capital. The humidity and the political climate are unbearably oppressive, and the denizens of D.C. do not give a fuck — at least, not literally. How do we know? I, along with fellow data scientist Rebecca Meseroll, collected over 10.7 million tweets from the contiguous 48 states and found out that ‘fuck’ appears in approximately 21 out of every 1000 tweets. In other words, slightly over 2% of all American tweets contain at least one variant of the word ‘fuck.’ Our analysis reveals a dearth of fucks in the District relative to the rest of the nation; the local fuck frequency in D.C. is a scant 11.7 per 1000 tweets. Language in other locales is not so chaste, however. Wyomingites, Californians, and Nevadans liberally peppered their tweets with profanity, exceeding 25 fuck-containing tweets per 1000 — more than twice their D.C. counterparts.
4. 6 Biggest Differences Between Airbyte And Singer
 We’ve been asked if Airbyte was being built on top of Singer. Even though we loved the initial mission they had, that won’t be the case. Aibyte's data protocol will be compatible with Singer’s, so that you can easily integrate and use Singer’s taps, but our protocol will differ in many ways from theirs.
5. The Simplest Way to do Exploratory Data Analysis(EDA) using Python Code
 EDA for Data Analysis or Data Visualization is very important. It gives a brief summary and main characteristics of data. According to a survey, Data Scientist uses their most of time to perform EDA tasks.
6. What is Ad hoc Analysis and Reporting, and Why Should you be Careful with it?
 This article originally appeared on the 3AG blog.
7. Top 40+ Data Science Product Interview Questions
 Find the top 40+ product interview questions you must prepare for your next data science interview.
8. Python for Data Analysis and Visualization

9. PySpark Cheat Sheet: Spark in Python
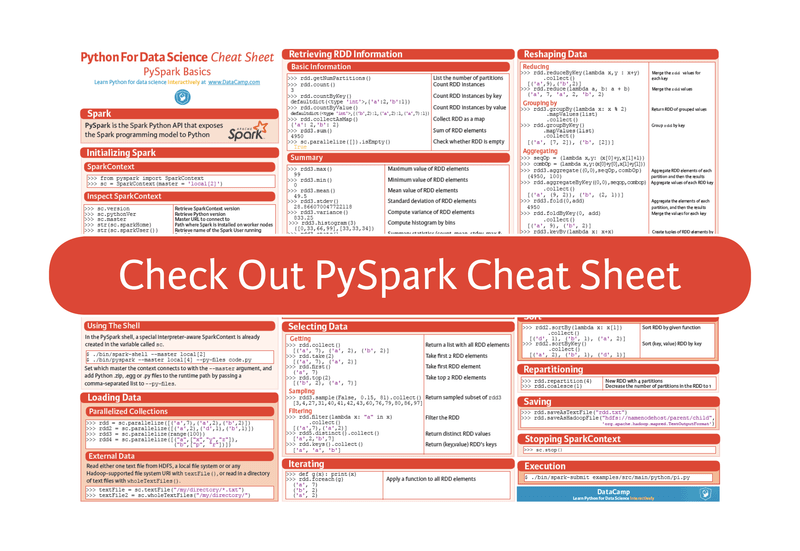 Apache Spark is generally known as a fast, general and open-source engine for big data processing, with built-in modules for streaming, SQL, machine learning and graph processing. It allows you to speed analytic applications up to 100 times faster compared to technologies on the market today. You can interface Spark with Python through “PySpark”. This is the Spark Python API exposes the Spark programming model to Python.
10. The Canadian Connection
 “The brain is at least twenty feet from his apparent forehead in life; it is hidden away behind its vast outworks, like the innermost citadel within the amplified fortifications of Quebec.” — Herman Melville, Moby-Dick
11. WTF is Automatic Speech Recognition?

12. An Introduction to 4 Types of Audio Classification
 Audio classification is the process of listening to and analyzing audio recordings. Also known as sound classification, this process is at the heart of a variety of modern AI technology including virtual assistants, automatic speech recognition, and text-to-speech applications. You can also find it in predictive maintenance, smart home security systems, and multimedia indexing and retrieval.
13. Why Python Is Leading the Charge in Data Analytics

14. XDL Framework: Delivering powerful Performance for Large-scale Deep Learning Applications
 Deep learning AI technologies have brought remarkable breakthroughs to fields including speech recognition, computer vision, and natural language processing, with many of these developments benefiting from the prevalence of open source deep learning frameworks like TensorFlow, PyTorch, and MxNet. Nevertheless, efforts to bring deep learning to large-scale, industry-level scenarios like advertising, online recommendation, and search scenarios have largely failed due to the inadequacy of available frameworks.
15. A Push in the Right Direction: Improving Notification Targeting
 As Alibaba’s second-hand trading platform Xianyu(闲鱼) has grown and developed, the amount of data it has to sort through has risen astronomically. With hundreds of millions of users, each with over one hundred dimensions for data indicators, user data presents a technological challenge for Alibaba: How can you quickly screen for a targeted population to carry out targeted customer operations using push notifications?
16. 3 Types of Anomalies in Anomaly Detection
 An Introduction to Anomaly Detection and Its Importance in Machine Learning
17. Data Visualization
 What is Data Visualization ?
18. Data Analysis with Python and Pandas
 Learn Python for data analysis and visualization by analyzing large datasets and covering Python 3, Pandas, and Seaborn.
19. When Will We See Bitcoin's Top?
 based upon only two data points (we can also look at 2011’s high, which was 30%), my feeling is price will top out when this statistic is near 47-48%
20. White Employees Are Heavily Over-Represented In Tech Leadership
 I collected and analyzed employment data by race for 57 of the biggest tech employers in the US (1). Here are the top level conclusions:
21. Popular Python Implementations [An Overview]
 You read it right. It's all about implementation. Today, we will talk about the different implementations of Python. A heads up on the different kinds, be it Cpython, Brython, you name it.
22. Who Carries Tech’s Top 100 Products of the Year? A Machine Learning Analysis.
 As a junior data scientist, most of the times training data are ready for me to train the model (either by accessing database/external csv file provided). However, dataset is not always available for us, we need scraping skill to make our life easier.
23. 4 Case Study Questions for Interviewing Data Analyst at a Startup
 At Holistics, we understand the value of data in making business decisions as a Business Intelligence (BI) platform, and hiring the right data team is one of the key elements to get you there.
24. Artificial Intelligence in Healthcare: Major Opportunities and Challenges
 Scientists consider that AI will revolutionize our world exactly the way electricity did a century ago. The integration of AI technology in Medical and Healthcare is a major leap forward. Although Healthcare and Medical AI will add extensively to the development and emergence of swift possibilities, it also faces certain challenges. Dexascan is considered to be one of the leading organizations that faced numerous challenges in healthcare Body Fat, Muscle & Bone Health and tried to overcome them at every possible step.
25. What are the Best Data Analytics Tools?
 Data analytics is used for transforming raw data into useful insights.
26. Future of Marketing: How Data Science Predicts Consumer Behavior
 Gradually, as the post-pandemic phase arrived, one thing that helped marketers predict their consumer behavior was Data Science.
27. The Art of Data Storytelling: How to Make Your Data Impactful

28. 5 Things to Watch Out for When Implementing Tableau BI

29. Tracking, Reproducibility and Collaboration in Data Projects
 Documenting your work is necessary, but boring, regardless of the type of work you do. While tracking and reproducing work for most generic web-connected applications and workflows is becoming more standardized (i.e., document state-saving and tracking through Google Docs and code collaboration and version control with git and Github) there is currently no widely accepted standard or simple automation for data science and machine learning. This is not to say developers and data scientists don’t track their work, but their process tends to be rinse and repeat, time-consuming, and rarely automated.
30. Key Aspects of Machine Learning Operations, Explained
 If you have ever worked or currently working in the IT field, then you definitely faced the common term «machine learning.
31. My Favorite Free Excel Courses for Programmers, Data Analysts, and IT Professionals
 If you want to learn Microsoft Excel, a productivity tool for IT professionals, and looking for free online courses, then you have come to the right place.
32. Tableau: Pareto Chart (20,80) — Top Products, Customers, …
 By the definition: A Pareto chart, is a type of chart that contains both bars and a line graph, where individual values are represented in descending order by bars, and the cumulative total is represented by the line.
33. Pornhub Growth Hack During Coronavirus Pandemic
 The 2019–20 coronavirus pandemic is an ongoing pandemic of coronavirus disease 2019 (COVID-19), caused by severe acute respiratory syndrome coronavirus 2 (SARS-CoV-2). The outbreak was first identified in Wuhan, Hubei, China, in December 2019, and was recognized as a pandemic by the World Health Organization (WHO) on 11 March 2020.
34. Simple linear regression using python without Scikit-Learn
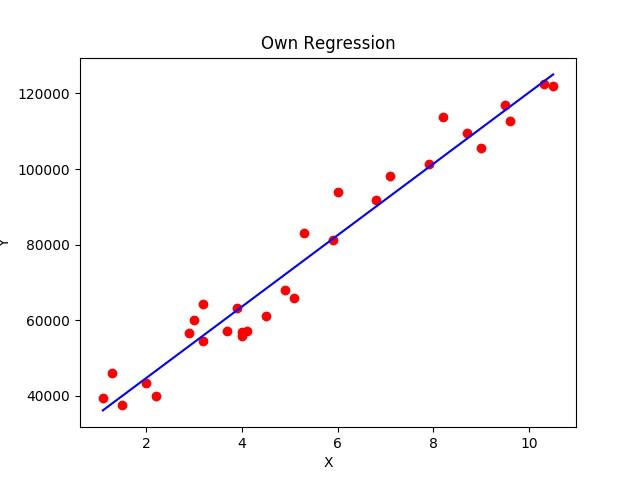 This is my first story in medium, in this story I am going to explain “How to Implement simple linear regression using python without any library?”.
35. Level Up Your Development Skills with Data-Driven Development

36. Overview of Exploratory Data Analysis With Python
 In this post I am giving a brief intro of Exploratory data analysis(EDA) in Python with help of
 pandas and matplotlib.
37. In Search of Data Dominance: Spark Versus Flink
 This article is part of Alibaba’s Flink series.
38. Merging Django ORM with SQLAlchemy for Easier Data Analysis
 Development of products with Django framework is usually easy and straightforward; great documentation, many tools out of the box, plenty of open source libraries and big community. Django ORM takes full control about SQL layer protecting you from mistakes, and underlying details of queries so you can spend more time on designing and building your application structure in Python code. However, sometimes such behavior may hurt — for example, when you’re building a project related to data analysis. Building advanced queries with Django is not very easy; it’s hard to read (in Python) and hard to understand what’s going on in SQL-level without logging or printing generated SQL queries somewhere. Moreover, such queries could not be efficient enough, so this will hit you back when you load more data into DB to play with. In one moment, you can find yourself doing too much raw SQL through Django cursor, and this is the moment when you should do a break and take a look on another interesting tool, which is placed right between ORM layer and the layer of raw SQL queries.
39. A Machine Learning Approach to IBM Employee Attrition and Performance
 In an IT firm, there are many Employee Architectures available. Some IT firms or at particular departments or certain levels follow the chief programmer structure, in which there is a “star” organisation around a “chief” position designated to the Engineer who best understands the system requirements.
40. Taking Data Visualization to Another Level
 When you tend to use one library for a certain period of time, you get used to it. But, you need to evolve and learn something new every day. If you are still stuck up with Matplotlib(Which is amazing), Seaborn(This is amazing too), Pandas(Basic, yet easy Visualization) and Bokeh, You need to move on and try something new. Many amazing visualization libraries are available in python, which turns to be very versatile. Here, I’m going to discuss about these amazing libraries:
41. How to Think Like a Data Scientist or Data Analyst

42. Why Big Data is Big Business: The Netflix Example
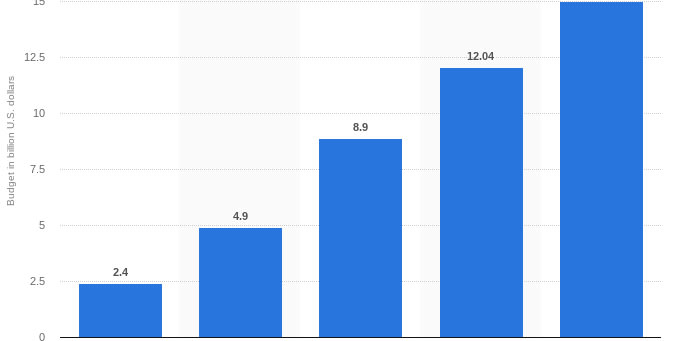 Take a look at the following chart:
43. How To Blend Data in Google Data Studio For Better Data Analysis
 Google Data Studio helps us understand the meaning behind data, enabling us to build beautiful visualizations and dashboards that transform data into stories.
44. COVID-19: "In God We Trust, All Others Must Bring [CLEAN] Data"
 In these difficult days for all of us, I’ve heard all sorts of things. From the fake news sent through Whatsapp, like vitamin C can save your life, to holding your breath in the morning to check if you’ve been hit by COVID-19. The mantra that everyone keeps repeating is “stay at home!”, okay fine, but what exactly does “stay home” mean? The question seems ridiculous when you think of a relatively short period, 15 days? A month? But if we look critically at the situation, we surely realize that it won’t be 15 days, and it won’t be a month. It will be a long, long time. Why am I saying this? Because “stay at home” doesn’t protect us from the virus. Staying at home is to protect our health care facilities from collapse. And I’m not saying that this is wrong. I’m just saying that if we want to protect the health care system from collapse, well then we’ll stay home a long, long time. But in doing so we will irreparably damage the economic system by profoundly changing our social and political model. It is inevitable. Let’s face it and not have too many illusions.
45. IPython Or Jupyter?
 Originally posted at: https://www.datacamp.com/community/blog/ipython-jupyter
46. Software Developer as Data-Scientist
 One advantage of a “contemporary” Software Developer jumping into the Data Science bandwagon is that for him/her the rate of technology change is a given and no frustrating experience.
47. How To Create Customer Segmentation using Google Analytics and A Spreadsheet
 Using Google Analytics, we can analyze our customer behaviors based on their interests, commonly features through clicks, time on page, bounce rate, custom events, etc. and their behaviors as shoppers, such as add to basket, average product quantity basket, LTV, AOV, etc.
48. Learn How To Group Data in SQL Using The GROUP BY Clause [Tutorial]
 Learn how to group data in SQL using the GROUP BY clause. In this article, I’ll show you this process by using a sample of marketing data.
49. How The Heck Did Robinhood Become So Popular? A Data Driven Analysis
 Robinhood launched over seven years ago as a stock prediction app, before it became the brokerage we have today.
50. Beyond Artificial Intelligence: Providing Insights to Your Customers
51. Analyzing Data From U.S. Road Accidents With Data Visualization
 In this article, we would be analyzing data related to US road accidents, which can be utilized to study accident-prone locations and influential factors.
52. 4 Tips To Become A Successful Entry-Level Data Analyst
 Companies across every industry rely on big data to make strategic decisions about their business, which is why data analyst roles are constantly in demand.
53. How To Become A Data Scientist: Skills & Courses To Learn Data Science
 The necessary skills to build a Data Scientist’s profile are business intelligence, statistical knowledge, technical skills, data structure, and more.
54. The Advantage Healthcare Providers Have In Health Tech

55. A Quick Guide To Business Data Analytics
 For many businesses the lack of data isn’t an issue. Actually, it’s the contrary, there’s usually too much data accessible to make an obvious decision. With that much data to sort, you need additional information from your data.
56. 20 Herramientas de Inteligencia Empresarial (BI) más Populares en 2020
 Business Intelligence (BI) es un negocio basado en datos, un proceso de toma de decisiones basado en datos recopilados. A menudo es utilizado por gerentes y ejecutivos para generar ideas procesables. Como resultado, BI siempre se conoce indistintamente como "Business Analytics" o "Data Analytics".
57. 21 Best Coursera Courses and Certificates for IT Professionals to Learn Data Science and Cloud
 Here are the top 20 Coursera Courses and Certifications to Learn Data Science, Cloud Computing, and Python.
58. Getting Started with Data Visualization: Building a JavaScript Scatter Plot Module
 Scatter plots are a great way to visualize data. Data is represented as points on a Cartesian plane where the x and y coordinate of each point represents a variable. These charts let you investigate the relationship between two variables, detect outliers in the data set as well as detect trends. They are one of the most commonly used data visualization techniques and are a must have for your data visualization arsenal!
59. Assessing Your Organization's Customer Data Maturity
 Investing in customer data is a top priority for marketing leaders.
60. 3 Best Ways To Import External Data Into Google Sheets [Automatically]

61. 10 Best React Native Chart Libraries
 Representing statistical data in plain text or paragraphs, tables are pretty boring in my opinion. What about you?
62. 4 Social Media Data Mining Techniques to Help Grow Your Online Business
 Social media data mining has become a must-have strategy for understanding current trends, culture, and online business. This is because the world of social media is a thriving, ever-growing ocean of data, where hundreds of millions of tweets, instagram posts, and blog articles are published every day.
63. Artificial Intelligence: The Future Of Travel Industry
 Machines may not have taken over the world yet, but they are seeping into our lives and making it better. AI is changing every aspect of our lives. From self-driving cars to talking bots, there are so many examples of AI in use today. The technology is disrupting so many industries, and the travel industry isn’t exempt from this. Gone are the days when you had to count on a travel agent to plan your next vacation. You no longer need to engage yourself in that tiresome chain of conversations with your agent for your travel arrangements. AI now infiltrates every aspect of the travel industry. With the help of this technology, you can get personalized and intelligent travel solution tailored according to your needs.
64. How Data Analysis Helps Unveil the Truth of Coronavirus
 These days we are all scared of the new airborne contagious coronavirus (2019-nCoV). Even if it is a tiny cough or low fever, it might underlie a lethargic symptom. However, what is the real truth?
65. Retraining Machine Learning Model Approaches
 Retraining Machine Learning Model, Model Drift, Different ways to identify model drift, Performance Degradation
66. Data Preprocessing and Data Wrangling in Machine Learning and Deep Learning
 Deep learning and Machine learning are becoming more and more important in today’s ERP (Enterprise Resource Planning). During the process of building the analytical model using Deep Learning or Machine Learning the data set is collected from various sources such as a file, database, sensors and much more.
67. Creating an Interactive Word Tree Chart with JavaScript
 Learn how to create beautiful interactive JavaScript Word Trees and check out an awesome Word Tree chart visualizing the text of The Little Prince.
68. Use the 80/20 Rule with Moderation

69. 7 Types of Data Bias in Machine Learning
 Data bias in machine learning is a type of error in which certain elements of a dataset are more heavily weighted and/or represented than others. A biased dataset does not accurately represent a model’s use case, resulting in skewed outcomes, low accuracy levels, and analytical errors.
70. The Operational Analytics Loop: From Raw Data to Models to Apps, and Back Again
 Over the next decade or so, we’ll see an incredible transformation in how companies collect, process, transform and use data. Though it’s tired to trot out Marc Andreessen’s “software will eat the world” quote, I have always believed in the corollary: “Software practices will eat the business.” This is starting with data practices.
71. Why Python is Best Programming Language for Data Science & Machine Learning?
 If you want to become a Data Scientist and are curious about which programming language should you learn then you have come to the right place.
72. I Used Python To Analyze My Peloton Workout Stats With Real-Time Updates
 A tutorial on how you can sync and analyze your Peloton workout stats into Coda with custom dashboards. Sync with a Google Apps Script or serverless function on
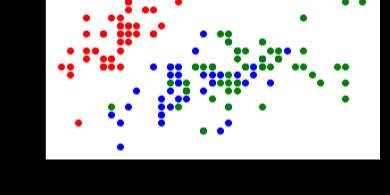
73. Application of Synthetic Minority Over-sampling Technique (SMOTe) for Imbalanced Data-sets
 In Data Science, imbalanced datasets are no surprises. If the datasets intended for classification problems like Sentiment Analysis, Medical Imaging or other problems related to Discrete Predictive Analytics (for example-Flight Delay Prediction) have unequal number of instances (samples or datapoints) for different classes, then those datasets are said to be imbalanced. This means that there is an imbalance between the classes in the dataset due to large difference between the number of instances belonging to each class. The class having comparatively less number of instances than the other is known to be minority with respect to the class having comparatively larger number of the samples (known as majority). An example of imbalanced dataset is given below:
74. TensorFlow Tutorial For Beginners
 Originally published at https://www.datacamp.com/community/tutorials/tensorflow-tutorial
75. Best Libraries That Will Assist You In EDA: 2021 Edition
 Exploratory Data Analysis (EDA) is an essential step in the data science project lifecycle. Here are the top 10 python tools for EDA.
76. How to Create a Bubble Map with JavaScript to Visualize Election Results
 A beginner level tutorial to get started with data visualization by creating an interesting and intuitive JavaScript bubble map
77. Data Science From Scratch

78. How to use Python Seaborn for Exploratory Data Analysis

79. 3 Best Ways To Import JSON To Google Sheets [Ultimate Guide]

80. A Complete(ish) Guide to Python Tools You Can Use To Analyse Text Data
 Exploratory data analysis is one of the most important parts of any machine learning workflow and Natural Language Processing is no different.
81. How to Build a Web Scraper With Python [Step-by-Step Guide]
 On my self-taught programming journey, my interests lie within machine learning (ML) and artificial intelligence (AI), and the language I’ve chosen to master is Python.
data-analysis
Photo credit, HackerNoon AI


Oldest comments (0)