
Before you start screaming at me for suggesting “no coding” required, read the whole article please. According to Gartner, Deep Learning / Machine Learning were at the Peak of Inflated Expectations in the hype cycle in 2017 and expected to reach Plateau in 2 to 5 years from then, wherein plateau is defined as
Mainstream adoption starts to take off. Criteria for assessing provider viability are more clearly defined. The technology’s broad market applicability and relevance are clearly paying off. If the technology has more than a niche market then it will continue to grow.
I am not saying Gartner is the gospel when it comes to technical trends, but it certainly feels like there is a push to commoditize certain machine learning processes.

If you are learning Data Science and Machine Learning, good for you ! It is a very sought after career right now and has a very bright future. I was pleasantly surprised to see how many people attended my online webinar on Introduction to Machine Learning on Watson Studio.
Projects in Data Science have a lifecycle just like the projects in Software Development. That being said, we have been developing software for a while and come a long ways from the good old days of waterfall.
YES, waterfall was a thing !
We have fortunately moved on to better practices like Agile Software Development, Extreme Programming and 12 Factor Applications. These tools and frameworks have given rise to methodologies that help us manage complex software deliveries. This is where I see the world of Machine Learning and Data Science heading as well.

In the not too distant past, Data Scientists worked in silos, doing their work on desktops and sharing Python and R scripts with their peers and external communities. Now, you have tools from big players like IBM and Google that make collaboration easier online with Watson Studio and Colaboratory respectively. While it is easy to share code with technical folks and dashboards with your non-technical friends, it is still hard to deploy your amazing models in a way that others can use it hassle free. Additionally, after you have deployed a model, you need to monitor it closely and re-deploy new improved models over time. This is the other learning over time in Machine Learning. A project lifecycle in data science may look as follows …
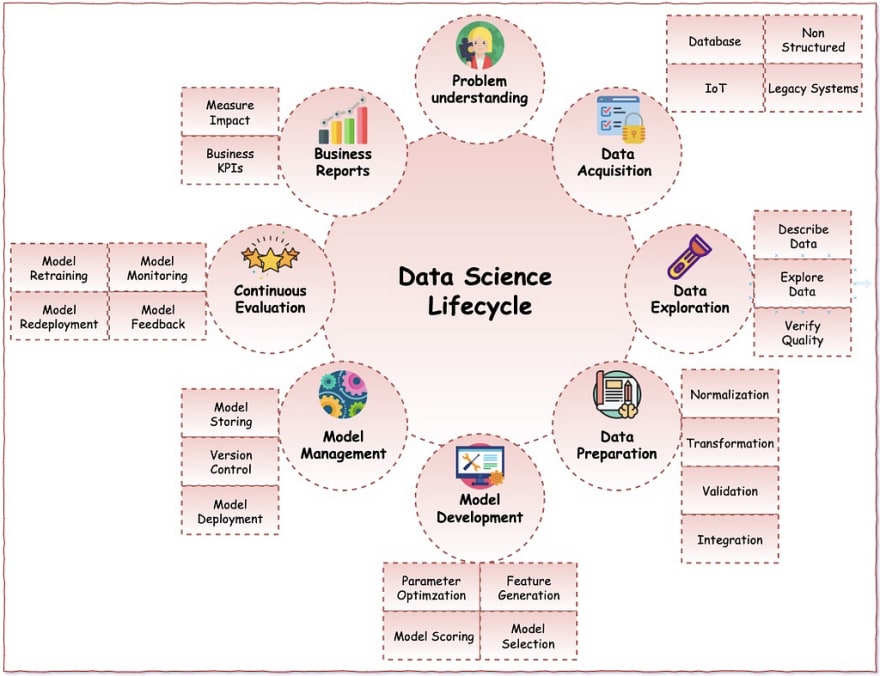
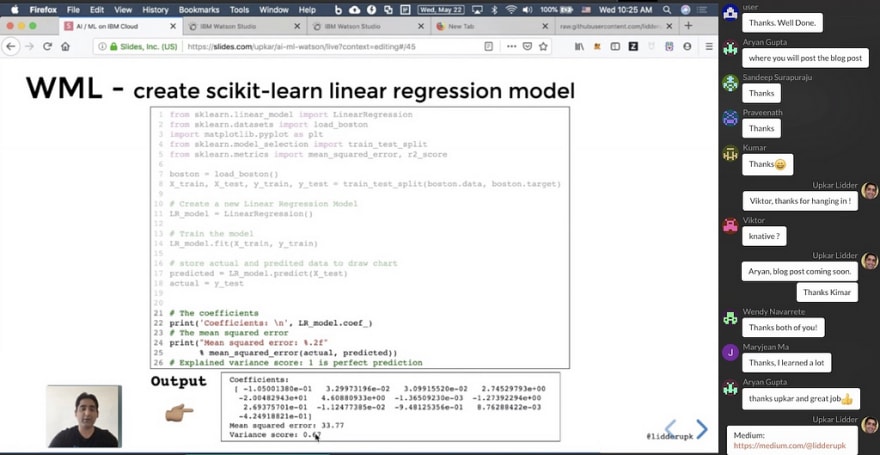
I am writing a series of articles to show some of the work IBM is doing to automate the Model Development, Model Management and Continuous Evaluation circles in the diagram above. We will use Linear Regression as an example. If you have taken any class on creating models or data science in general, you have probably worked with Housing data to predict the price of a house with a given #bathroom, #bedrooms, size (sqft), #garage, etc. This problem normally falls under Linear Regression — a supervised learning problem where you are training with labeled data and predicting a continuous variable (house prices). We are going to use the Boston Housing Price dataset from scikit-learn. Instead of predicting house prices, we will predict the median house price (MEDV) in a given suburb if we know the following pieces of information about the neighborhood …
CRIM : Per capita crime rate by town
ZN : Proportion of residential land zoned for lots over 25,000 sq. ft
INDUS : Proportion of non-retail business acres per town
CHAS : Charles River dummy variable (= 1 if tract bounds river; 0 otherwise)
NOX : Nitric oxide concentration (parts per 10 million)
RM : Average number of rooms per dwelling
AGE : Proportion of owner-occupied units built prior to 1940
DIS : Weighted distances to five Boston employment centers
RAD : Index of accessibility to radial highways
TAX : Full-value property tax rate per $10,000
PTRATIO : Pupil-teacher ratio by town
B : 1000(Bk — 0.63)², where Bk is the proportion of [people of African American descent] by town
LSTAT : Percentage of lower status of the population
Even if you were to use a cool and fancy ML framework to create a fantastic Linear Regression model instead of the guided approach we took in the webinar, what’s the next step ? Your friend wants to use this model to figure out how much to list their house for. Where do you host our model so that your friends can use it. How do you evaluate the model on an ongoing basis and improve performance over time ? How do you scale your model ? Let’s look at some options provided on IBM Cloud. There are two solutions that come in handy …
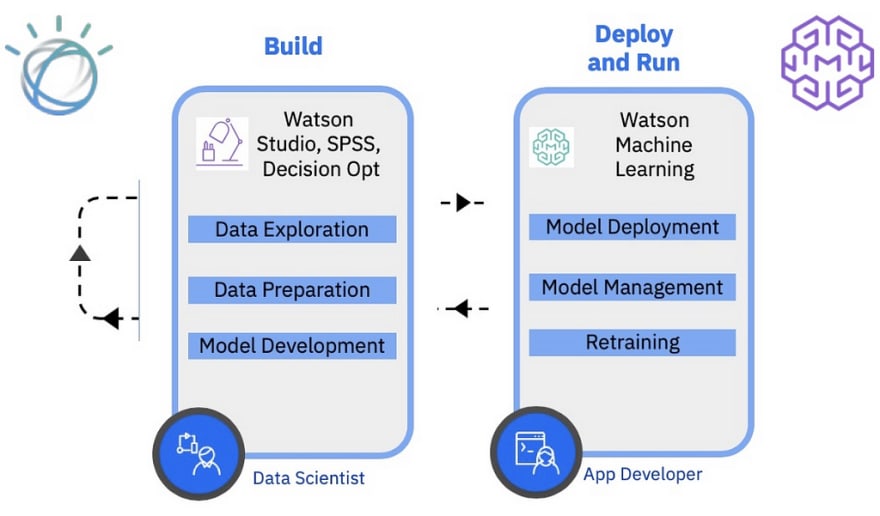
We will use IBM Watson Studio Model Builder to build and save a ML model and then use the Watson Machine Learning Service to deploy the same model. To sign up with IBM Cloud use the link
http://bit.ly/waston-ml-sign
… and then follow the steps in the slides below.
If you are short on time, you can watch this shorter video
Finally, you can watch the replay of the webinar here if you have an hour to spend with yours truly !
Introduction to Machine Learning with Watson Studio Online Meetup
Thanks to Neeraj Madan to review the Data Science Lifecycle diagram and Max Katz to host the online meetup !


Latest comments (0)