| The AI Alpha Geek: It starts with EDA! - Part A |
|---|
| The AI Alpha Geek: It starts with EDA! - Part B |
| The AI Alpha Geek: It starts with EDA! - Part C |
Now, let's see feature relationships i.e exploring 2 or more features together. Let's look at the code example below -
Let's take a look at the Pclass and Survived features below produced from Line 1:
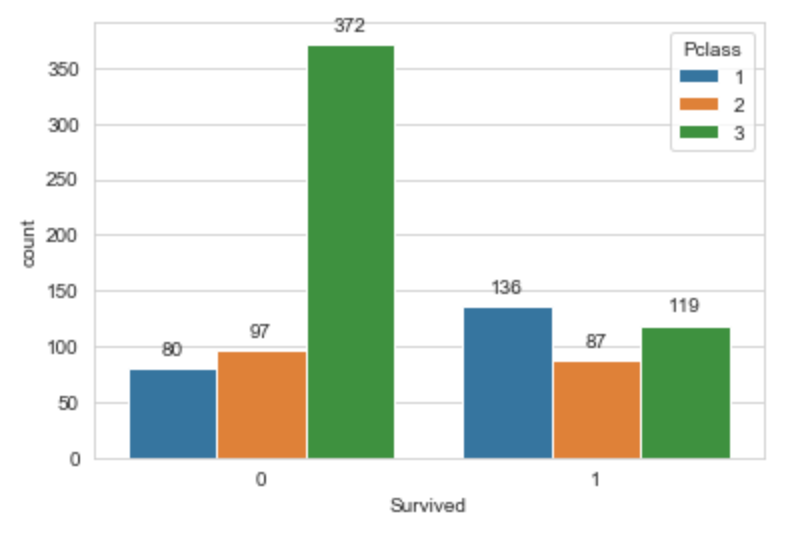
From the count plot output above, which is produced from Line 1, it seems:
- a lot more people in the lower class, i.e class 3, didn't survive.
- more people in the upper class, i.e class 1, survived.
To know the why's behind the insights above, you can ask questions like:
- could it be that passengers in the upper class had the opportunity to escape because they were situated on the upper deck of the titanic?
- probably when the ship hit the iceberg, the lower deck flooded and some passengers drowned?
- perhaps those at the upper deck were given preferential treatment?
Now you must also be wondering what gender had a higher survival rate? Look below:
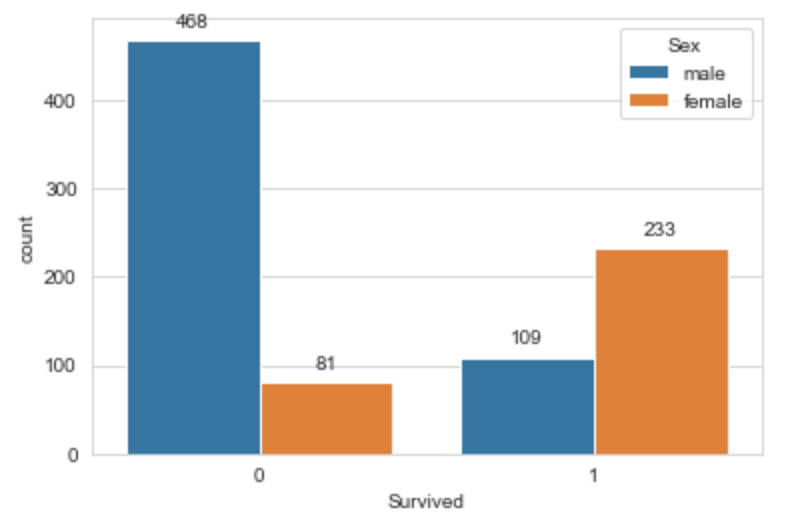
From above, remember in Part B that the total number of people who survived is 549 - So, we can see that a lot more males didn't survive.
The above insight brings more questions comes to mind:
- could it be that women and children were saved first before adult males?
- could it be more males gave their lives for their loved ones?
Now, let's see how more than 3 features relate below:
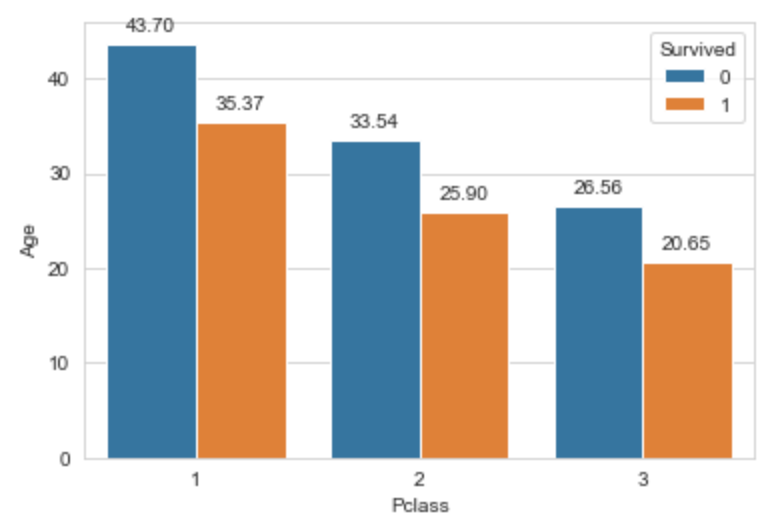
From the bar plot output above, produced from Lines 7, it seems that:
- for each class, passengers with a younger average age survived.
Then, looking at features Age, Sex and Survived below:
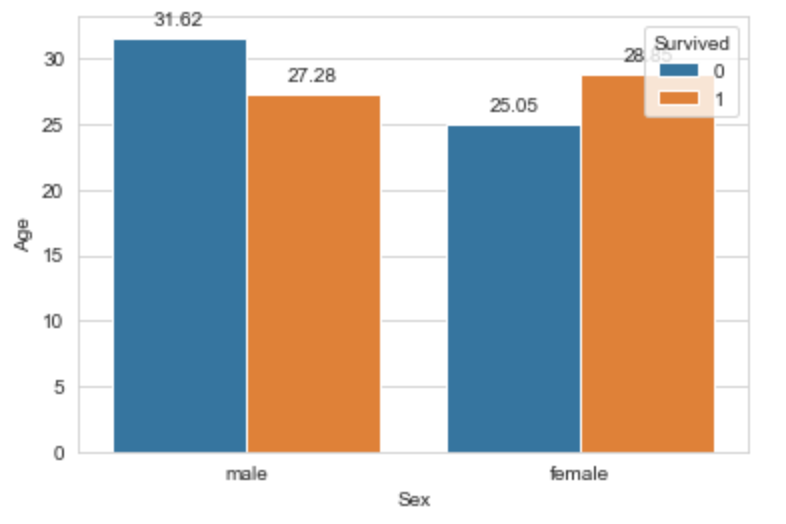
From the above, it is visually obvious that males and females with an average age of 27.28 and 28.86 respectively survived.
Let's visually explore the Fare feature output for Lines 13 and 14 below:
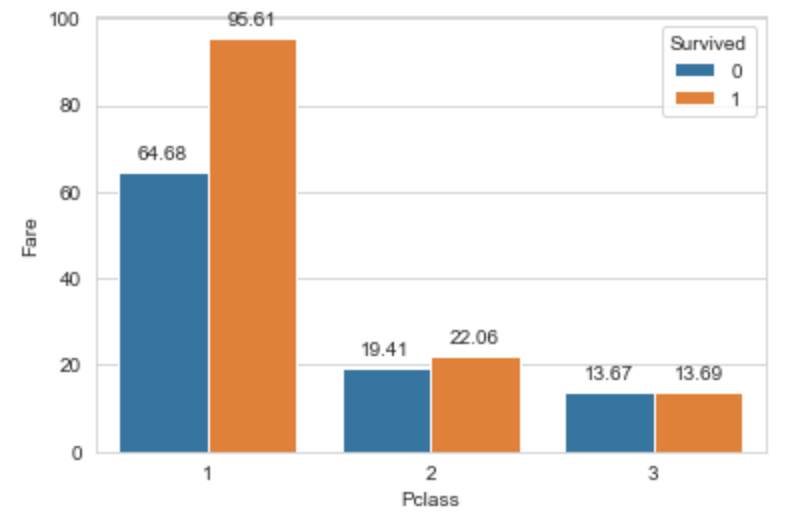
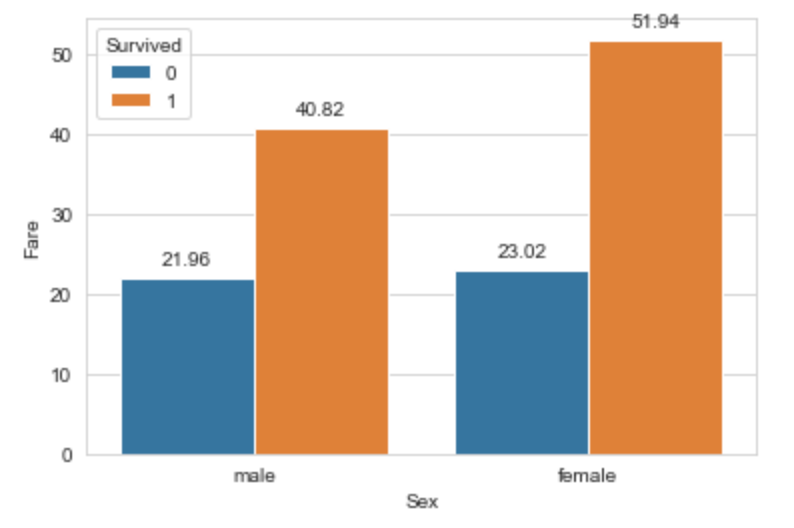
From the above, it seems that:
- males who survived paid an average fare of 40.82,
- while females paid an average fare of 51.94.
- those who did not survive had a much lower average fare for both males and females.
When you run other lines of code for other features that include Embarked, Parch, and SibSp, you will draw much more valuable insights from the data.
We sure got more insights which improves how much we understand our data. So, always try to understand or ask about the why behind insights discovered. Stay tuned for the next part where we collate all insights and valuable patterns and dive into Feature Engineering still using the titanic dataset. Have an amazing December! 😉


Top comments (0)