While browsing the web on the internet's favorite browser, Google Chrome, everyone at some point has accidently pressed ctrl + shift + I (⌘ + option + J for mac users) and encountered the Chrome DevTools panel. To anyone who isn't learned in the ways of software programming or at least familiar with its basics, this daunting wall of texts, tabs, buttons and icons may as well be like looking at a wall of ancient Egyptian hieroglyphics. The ancient cryptic language of the extraterrestrial beings that blessed us with the internet. But after a few months of learning how to read and write basic JavaScript, HTML and CSS and a tutorial or two about the different features that the DevTools panel offers, not only does the panel become a bit demystified and easier to read, but it also shines as one the best tools available to modern day web developers.
So, while the understanding of many of its more advanced features still eludes me, I'm going to attempt to write a brief basic overview of the ones that I do understand and have been of vital use to me as I start my career in web development. Mainly the Elements, Console, and Sources Tabs.
Elements Tab
The first thing to usually pop up when viewing the DevTools console is the elements page. This is the page I was referring to when I said "a wall of Egyptian hieroglyphs". At a closer look and with little bit of understanding, you can see that all that text is actually the pages HTML elements, neatly divided into it's different categories able to be toggled on and off to make for an easier read.
Scrolling over the different elements highlights the portion of the page that it pertains to and you can right click on any portion on the page and it will highlight its corresponding tag in the console.
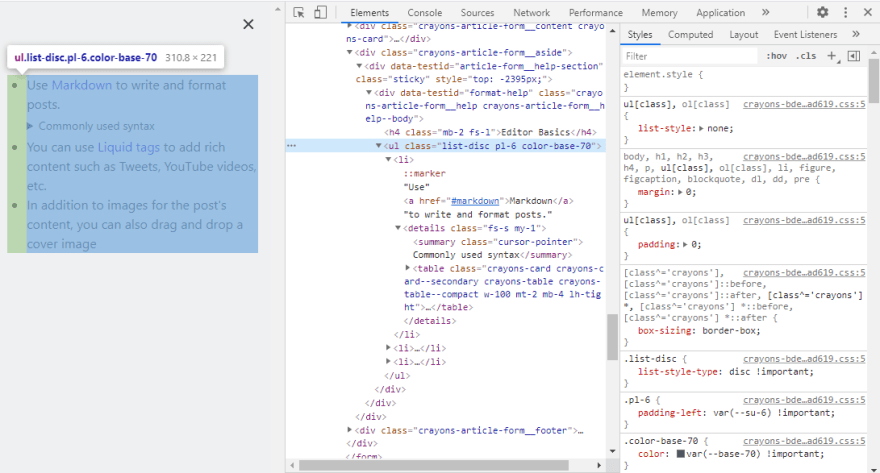
In the styles tab to the right of the HTML, you can see and even play around with the different CSS elements that each tag has.
You can go to any webpage you like, right click something on the page that you want to interact with, and use the styles tab to temporarily (all the changes go away after a page refresh) change it's properties such as color, or text font or even what the text it self says. The possibilities are only limited by your knowledge of CSS. This is extremely useful when styling your own page, so you can quickly try new things to see what works for you without having to commit to permanent changes in your CSS file.

Console Tab
Next up we have the console tab. My first encounters with the console tab happened while watching online tutorials on basic JavaScript concepts in the earlier phases of the boot camp. While we were still using resources like repl.it to write our code, all the instructors would be using the console in the DevTools in their examples. Now the console tab works mostly like the console of any other JavaScript IDE.
You can write your code and view it's results in real time. What I really like is that it will display the output of anything thing you type under your code as you type it. This allows you to quickly and dynamically test out different things without having to manually console.log each and every bit of your code to see what's going on.
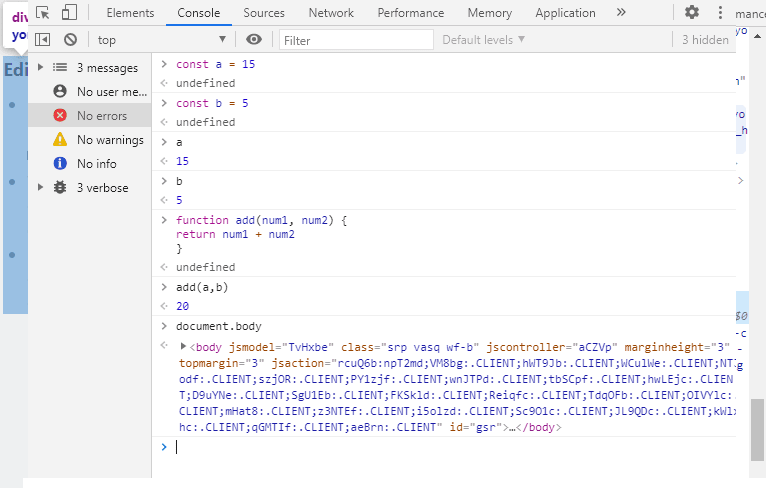
One problem I ran into with online IDE's like repl.it was that while it's great for playing around with basic code, when it came down to more practical and advanced uses of a console, such as working on functions that depended on a JSON or working with JavaScript libraries such as underscore and jQuery, it becomes impossible to use those within the online IDE's, but since the chrome page it self has a more complete picture of JavaScript functionality, its console is much more useful.
Sources Tab
The sources tab is the home base for debugging. Its contents are broken down into three main divisions, the source file navigator, the code editor and the debugger. The file navigator allows you to view all the files and their relative locations for the respective webpage. When selected, each of these files can be opened up in the code editor to view and to edit.
The real star here though is the debugging panel. The debugging panel has quiet a few features, but I'll talk about the two I am most familiar with. Breakpoints and Watch Expressions.

Breakpoints are the bread and butter of debugging. They allow you to select certain points in your code and then run your program up to that point. After setting a breakpoint you can execute and visualize your code up to that point step-by-step.
In addition to manually setting your breakpoint, the event listener breakpoints feature will let you select a particular event type such as mouse click or a key press to set a break point at.
When a breakpoint is set and the code is initialized up to that breakpoint, all variables that have been defined so far become available to be checked and evaluated within the console. These can also be viewed inside the scope pane. Lastly, the watch expressions panel allows you to enter any JavaScript expression and monitor its result in real time.
Conclusion
In conclusion, while I have only begun to scratch the surface of the DevTools' capabilities, its addition to my repertoire has greatly improved the level at which I'm able to interact with and understand the complexities that go behind web development. As I become more proficient with the tools I know how to use, I only become increasingly excited to learn about the rest as I continue on my journey into deciphering what goes on behind the scenes of all the programs and applications that I have been using for so long.
sources:
https://www.udemy.com/devtools-2017-the-basics-of-chrome-developer-tools/
https://developers.google.com/web/tools/chrome-devtools/javascript


Top comments (0)