WiGLE has been around a while and is a great site to explore the pervasiveness or sparsity of Wi-Fi (and cellular) networks around the globe. While interactive use is fun, WiGLE also has a free API (so long as you obey the EULA and aren’t abusive) that lets you explore a little deeper if you register for an account, get a key, and use the WIP wiglr | GL| GH package.
Install from your least offensive social coding site:
devtools::install_git("https://sr.ht.com/~hrbrmstr/wiglr")
# or
devtools::install_gitlab("hrbrmstr/wiglr")
# or (if you must)
devtools::install_github("hrbrmstr/wiglr")
read the code (to ensure R package developers are pwning or tracking you),and …after putting your “Encoded for use” token in the WIGLE_API_KEY environment variable…start exploring!
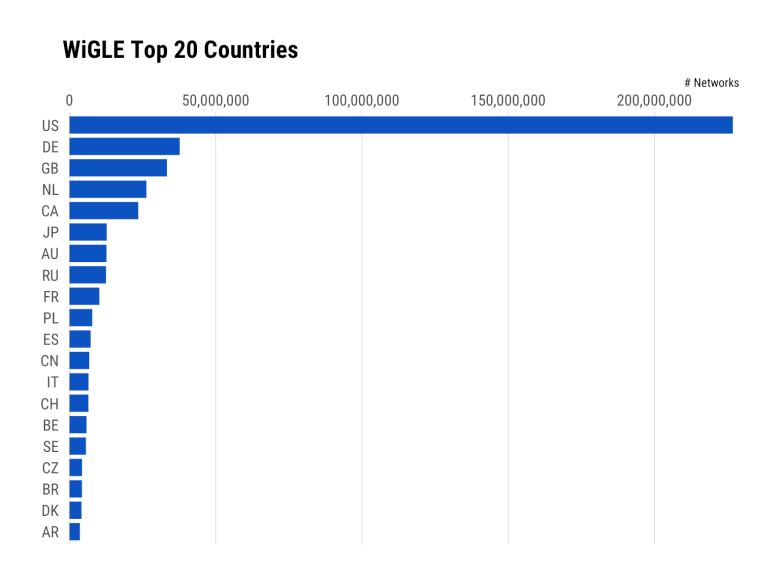
Let’s pull all the country stats and plot the top 20:
library(wiglr)
library(hrbrthemes)
library(tidyverse) # for show

cc <- wigle_country_stats()

top_n(cc, 20) %>% # show top 20
  mutate(country = factor(country, levels = rev(country))) %>%
  ggplot(aes(count, country)) +
  geom_segment(aes(xend=0, yend=country), size = 6, color = ft_cols$blue) +
  scale_x_comma(position = "top") +
  labs(
    x = "# Networks", y = NULL,
    title = "WiGLE Top 20 Countries"
  ) +
  theme_ipsum_rc(grid = "X")
We can also supply a bounding box and find all the Wi-Fi access points in the vicinity and use leaflet to make a handy interactive map (you can add other columns, too, to find fully open ones):
library(leaflet)

wifi_box <- wigle_bbox_search(43.2468, 43.2806, -70.9282, -70.8025)

wifi_box$results %>%
  mutate(labs = sprintf("SSID: <code>%s</code><br/>Encryption: %s", ssid, encryption)) %>%
  leaflet() %>%
  addTiles() %>%
  addCircleMarkers(~trilong, ~trilat, radius = 1, popup = ~labs)
Click on the image to see the widget…

There’s good but not complete WiGLE API coverage:
-
wigle_about_me: Get WiGLE user object for the current logged-in user -
wigle_api_key: Get or set WIGLE_API_KEY value -
wigle_bbox_search: Get WiGLE named map of general statistics -
wigle_country_stats: Get WiGLE statistics organized by country -
wigle_region_stats: Get WiGLE statistics for a specified country, organized by region -
wigle_site_stats: Get WiGLE named map of general statistics
FIN
The package is a WIP but the API is really straightforward, so if you’re looking to contribute to a (dare I say “fun!”) open source project in 2019 now’s your chance! Just drop an issue on whatever social coding site you prefer (ping me in a comment if you use something besides SourceHut, GitLab or GitHub and I’ll get the package up there) and spec out what you’d like to do or just file a well-articulated PR. Potential areas to enhance are:
- support for more search parameters
- a function for automatic pagination
- cover the remaining search/retrieval API endpoints
- investigate how to use R to submit readings
- create an internal package Shiny app for exploring WiGLE straight from R
- develop standard base visualizations and add them as package functions
- write a vignette
- improve package docs
- develop a statistical model for the likelihood on finding free/open Wi-Fi in an area or the impact of Wi-Fi/cellular deserts on communities by layering in Census data
Working with or developing for the package may also help shed some light on yet-another-way we’re exposed in the digital world.
As always you’ll get judgement-free help/suggestions. full credit in the DESCRIPTION and the fame and glory of CRAN if it ever makes its way through the process. The package does just enough for me right now so it will be a while before I get to the above TODO list if others don’t jump in first.


Top comments (0)