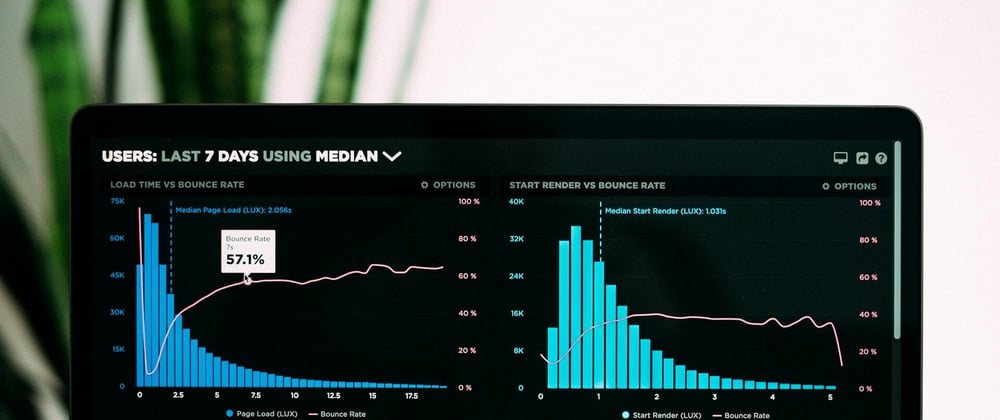
Data Studio is the perfect tool to use for data visualization. It has native connection to most of your usual data sources, ranging from standard MySQL, PostgreSQL to modern data warehouses/analytics engine like BigQuery. It provides basics charts & visualization for a wide range of users, from the basic non-tech-savvy individuals to superusers who are already accustomed to creating visualizations in Python, R, or JavaScript.
On visualization parts, it already serves the everyday common users with the most common types of graphs.
However, as I start to venture further into projects, in which there are multiple clients who want something unique, heavily customized versions of some types of charts that it is not already available in either the provided charts or the community charts, it was then that I tried to do something bold, creating my own visualization, using Data Studio Custom Visualization with Javascripts. And the library that I used to make chart is Chart.js, since it is simple and does the job well.
The Problem
This is the chart that the client want to make, it is called a Arc Reactor Chart. The name is familliar to me, since I've already seen this type of charts on some other visualizations platform like PowerBI or Tableau, but the problem is that Data Studio does not have it natively, hence I need to custom build it.
Tech Stack/Prerequisites
-
Google Cloud Platform: Since you already using Data Studio, this should be familiar to you.
- Google Cloud Storage: This is where you "host" your visualizations files
- gcloud SDK: To build & push your products into GCS
-
Node.js: For npm
Create a GCP Project & a GCS Bucket
Creating & Managing Projects.
We will start by creating a GCP Project. IIRC, it does not require adding your billing info yet, as it provides us a generous $300 free trial credits to help us being naughty inside Google's proud cloud systems.
This should be the final results of the above step.
Next, you will be creating a GCS Bucket to host our data. The bucket should be Public to the Internet.
This should how it would look.
After getting your bucket, create 2 folders, /dev and /prod. This is where we are going to host our visualizations.
By the end of this step, you would need to note down the paths to our buckets, which are
gs://your-bucket/devgs://your-bucket/prod
Using gcloud
You will need to install gcloud SDK. After that, open up a new terminal and type in gcloud auth login to login to your account & to select your current projects.
Initialize the Project
Using your favorite terminal, cd into your desired folder, and type npx @google/dscc-gen viz. This would walk you through the initialization of your new project. You will need to provide:
- Project name
- Path to dev folder on GCS
- Path to prod folder on GCS When the wizard is done, you will have your project initialized, and you can start developing your visualization here using your IDE.


Top comments (0)