
Hey!
Another project here! This was done using one of my favorite tools for Data Analysis, Microsoft Excel! I still feel there’s nothing you can’t do with Excel, it’s literally one of the most powerful tools out there.
*****
In this project, data cleaning, exploration and visualization was done using only Microsoft excel.
Analysis was done to provide an end of the year summary of the company’s employment structure based on department, performance score, and current status.
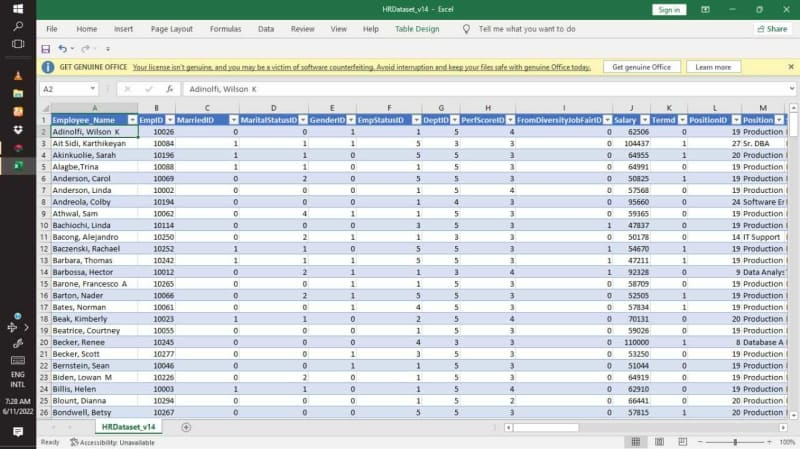
Data structure: This dataset originates from the HR department of the company. The dataset contains records of employees ranging from name, gender, marital status, salary, country, state, department, recruitment source, performance score, etc.
Data cleaning and preparation:
The data cleaning and preparation phase was done to ensure the dataset is free from errors, outliers and duplicates.
Here is a picture of the dataset prior to cleaning:
Some of the steps taken to clean the data include:
Removal of duplicates
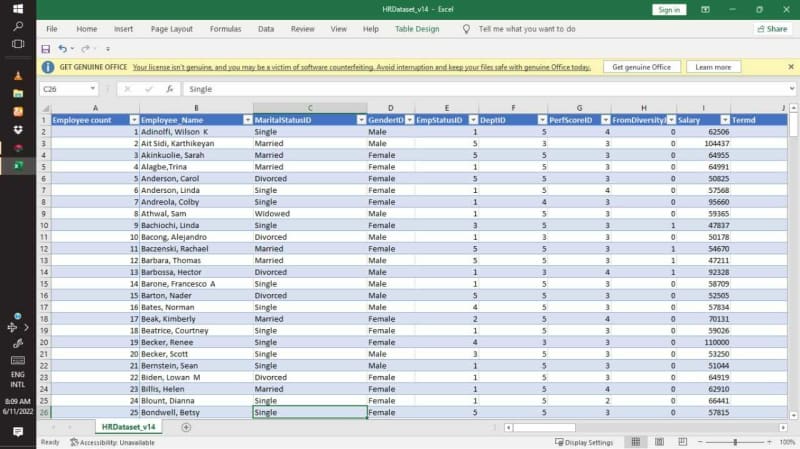
The marital status column and gender column were edited to aid better understanding of the values in the rows. The find and replace function in Microsoft excel was used to replace the M and F in the gender column to male and female.
The marital status column was also edited; 0, 1, 2, 3, 4 was replaced with single, married, divorced and separated, respectively.
Here is a picture showing how the find and replace function was used to replace the values in the marital status column.

3.An additional column was also created, Employees count column. It was necessary to create this column as it would be pivotal in all the analysis carried out.
Here is a picture of the dataset after the data cleaning process.
Analysis and insights:
Analysis was done using pivot table and charts.
Slicers were also added for easy access to various niche of the dashboard.
The dashboard provides answers to the following :
1.Employees count by gender
2.Employees count by department
3.Employees count by performance score
4.Employees count by current status.
Here is a picture of the dashboard:

Thank you for reading!


Oldest comments (1)
Beautiful project. Well done boss 👏