Cloud platforms like Heroku make it easier than ever to host applications: just upload your code, and they’ll deploy it for you. But a common misconception is that, because you don’t own the infrastructure, you can’t really monitor your applications or see under the hood.
Fortunately, Heroku gives you complete observability over your apps. You can access important metrics including CPU and RAM usage, logs, HTTP requests, and runtime metrics, using a number of logging and debugging tools – like the Heroku Dashboard, Logplex, and in-dyno remote debugging. You can even extend your monitoring capabilities through third-party add-ons, which range from error monitoring services to complete application performance monitoring (APM) solutions.
Observing and Debugging using Heroku’s built-in tools
The following methods are built into the Heroku platform and are available for all apps:
Aggregated Logs
Logs provide detailed records about your apps and infrastructure. They’re useful for extracting data from apps for troubleshooting and debugging, monitoring operations, and tracing requests. Logs are also commonly used for auditing and regulatory compliance. Logplex, Heroku’s log routing facility, stores up to one week of logs, but you can use a logging add-on or log drain to automatically export your logs.
Heroku aggregates logs created by running apps and the Heroku platform itself. These include:
- Build logs
- App logs printed to stdout or stderr, across all of the running dynos (containers)
- System logs generated by the Heroku platform, such as app restarts or crashes
- API logs, which are administrative actions performed by you or other users
- Logs from add-on services, such as an attached database
You can access logs through the Heroku Dashboard, the Heroku CLI, or by consuming logs through Logplex directly.
Heroku Dashboard
The Dashboard gives you an at-a-glance summary of your apps. It’s useful for real-time monitoring, detecting anomalies such as crashes or changes in resource consumption, and overall trends. For example, if you are deploying a new app or upgrading an existing app, the Dashboard can immediately show the impact on resource usage and throughput.
Just log in and you’ll see the Dashboard: it provides a complete overview of your apps, resources, and add-ons. It shows dyno activity, metrics (aggregated by process type), logs, and activities affecting your apps. The Dashboard can also notify you of potential problems and link you to relevant documentation resources.
The dashboard displays the following metrics:
- Memory capacity and usage
- CPU load
- User-initiated events, such as configuration changes and dyno restarts
- Heroku platform events
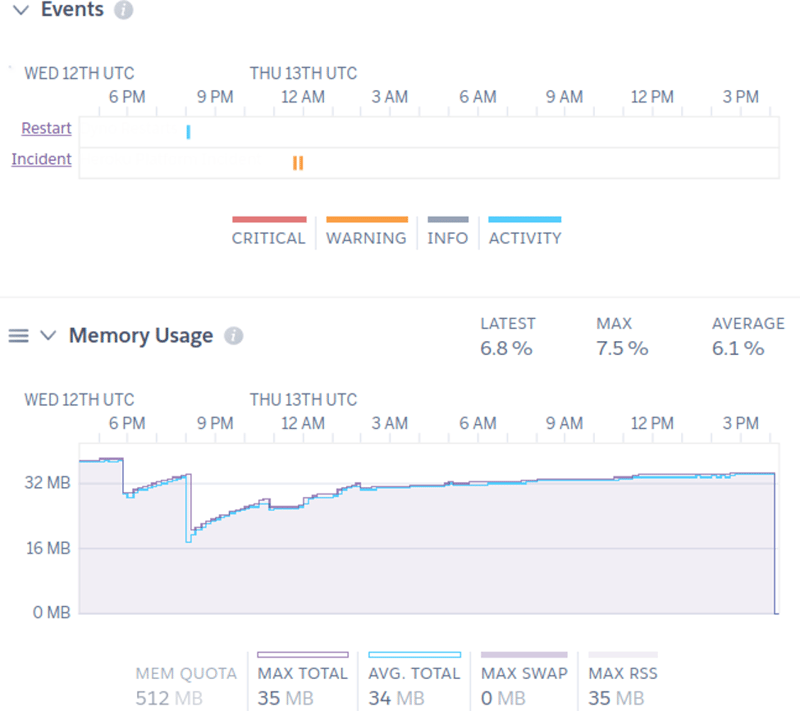
Event history and RAM usage reported on the Heroku dashboard
You can get even more specific metrics depending on what your process type is. For instance, apps that use the web process type show HTTP response times and throughput:
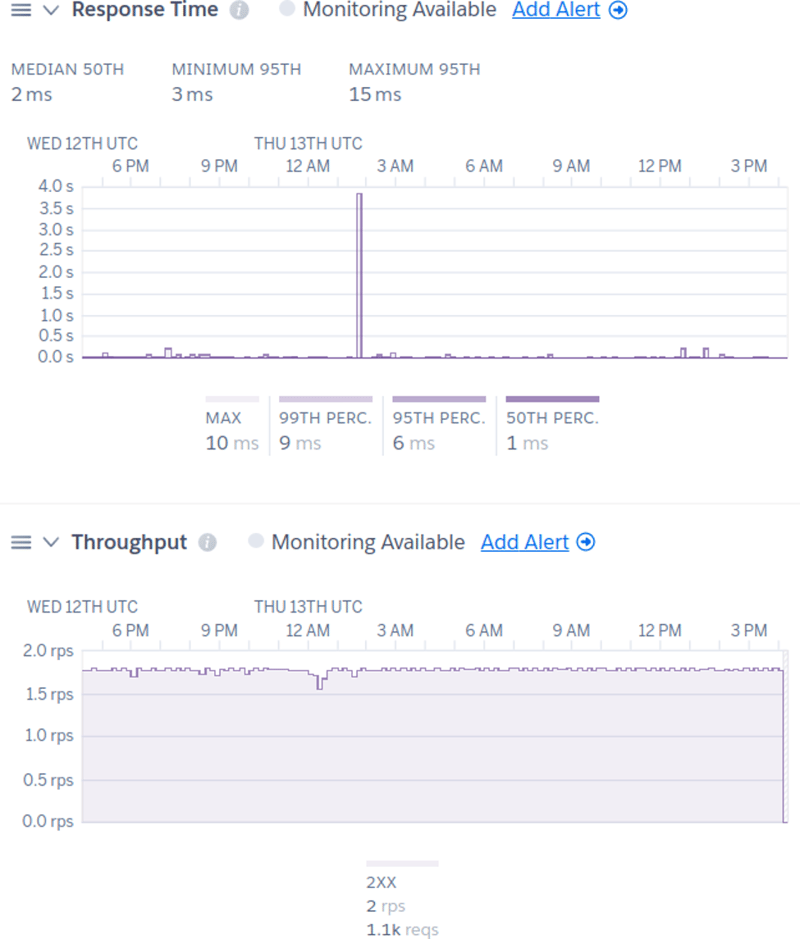
Metrics for web dynos on the Heroku dashboard
Language Runtime Metrics
For a deeper look into your app’s specific runtime context, runtime metrics complement the Dashboard by adding language-specific metrics to help with debugging and optimizing your apps. Heroku collects runtime metrics for several languages including Java, Go, Node.js, and Ruby.
These metrics offer additional insights about your apps such as detailed memory allocation, garbage collection runs, and latency. For example, Node.js applications can report their time spent in garbage collection, garbage collection runs, event loop latency, and event loop blocks. These are automatically added to the Dashboard after enabling language runtime metrics.
While they may use additional resources, enabling runtime metrics takes seconds. In the case of Java and Node.js, no code changes are required.
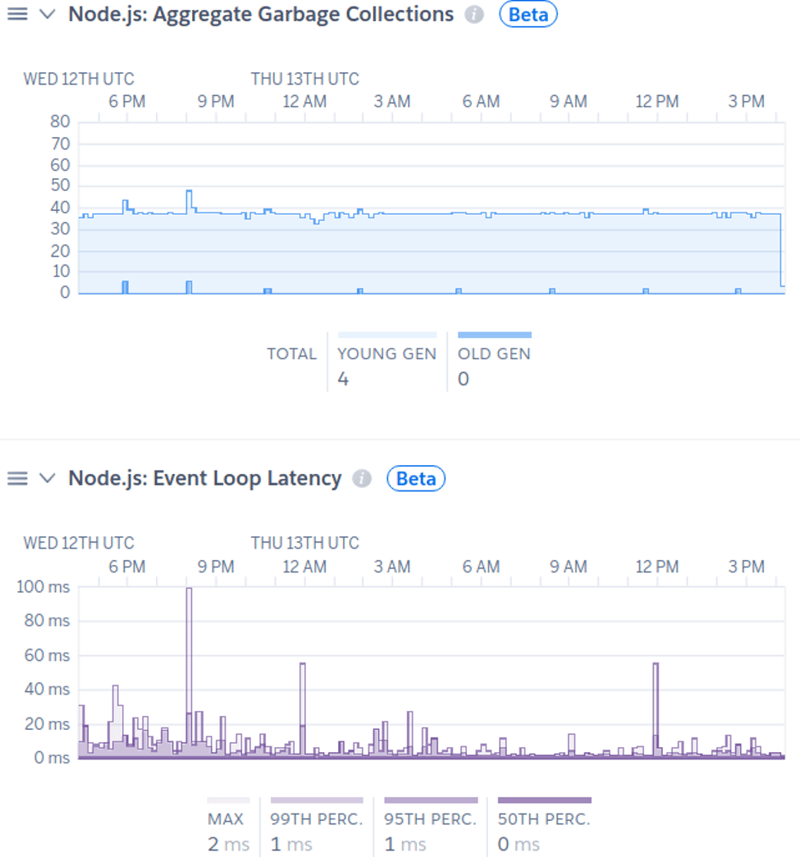
Subset of Node.js runtime metrics collected by Heroku
Heroku Exec
Heroku Exec is useful for debugging issues that can’t be reproduced locally. It creates an SSH tunnel into a dyno, letting you run commands and open remote debugging sessions. For problems that can’t be resolved with logs or metrics, Heroku Exec lets you go straight to the source.
To enable remote debugging for Node.js apps, you can open a remote debugging port by adding the --inspect= parameter to your Procfile. For Java applications, you will need to enable the Java Debug Wire Protocol (JDWP). You can also use the Heroku CLI’s Java plugin to run debugging tools such as VisualVM, jmap, and jstack. See the Heroku Exec documentation for detailed instructions.
After redeploying your app, forward the remote debugging port to your local system using:
$ heroku ps:forward
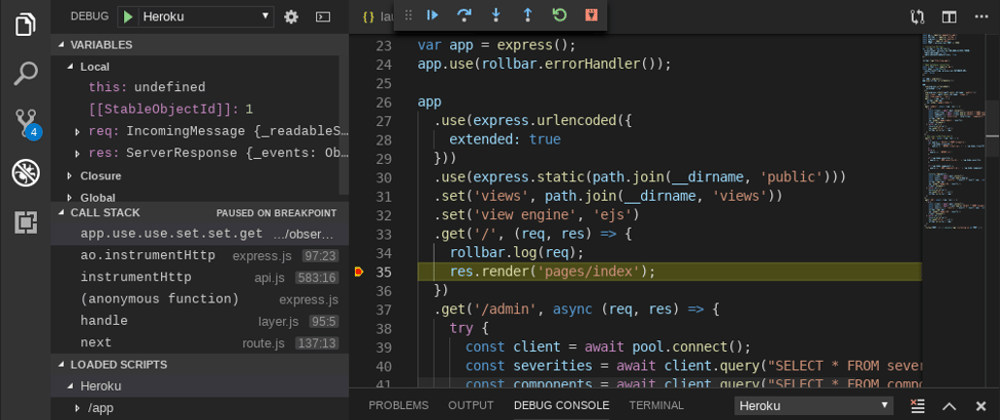
As an example, here we use Visual Studio Code to debug a running Node.js dyno:
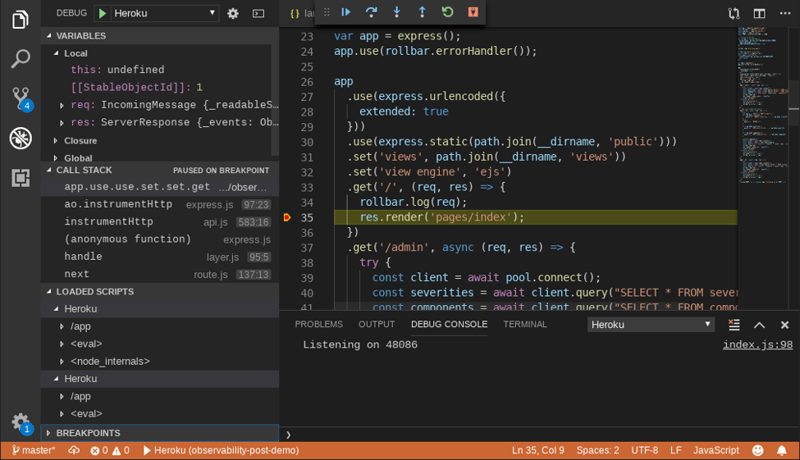
Debugging a Heroku app in real-time using Visual Studio Code
Monitoring via Add-ons
If native solutions don’t fit your needs, you can choose from hundreds of add-ons that provide additional monitoring functionality. We’ll list a few of them here.
Logging
Logging add-ons provide additional log management functionality such as searching, indexing, graphing, and creating alerts.
There are several logging add-ons available from third-party services such as Sumo Logic and logz.io. Furthermore, many services can automatically parse out Heroku logs, making them easier to search and track trends over time with custom dashboards and alerts. For example, SolarWinds Loggly offers a preconfigured dashboard for Heroku logs, giving you a visual overview of HTTP status codes and which paths are missing resources.
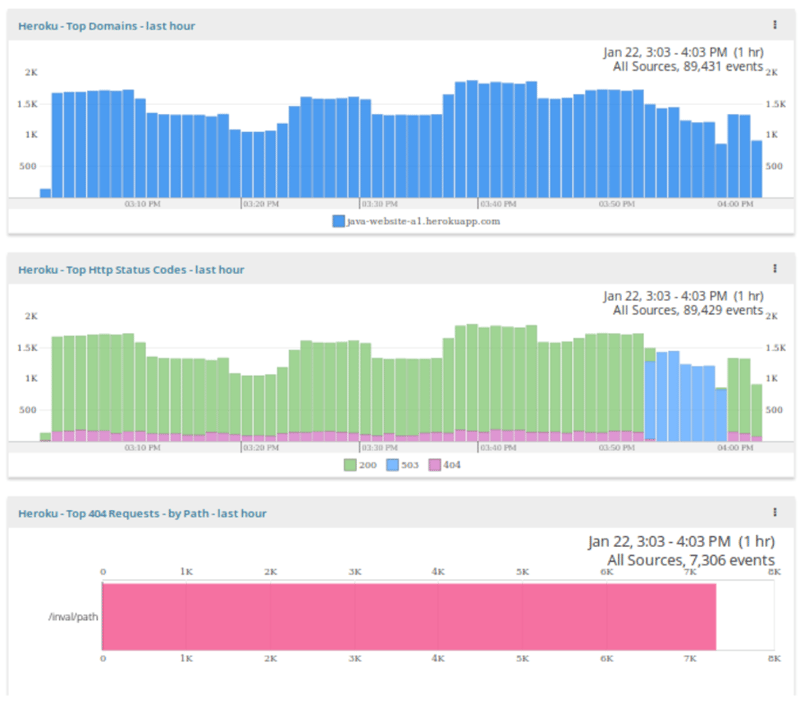
Charting the top domains, HTTP status codes, and paths resulting in 404 errors in SolarWinds Loggly
Application Performance Monitoring (APM)
There are several monitoring add-ons available from vendors such as New Relic APM and Scout. These add-ons let you gather more detailed application performance metrics including individual transaction times, database calls, cache hits, and time spent in various components. This can help you identify the cause of performance problems and errors.
For example, AppOptics shows the following breakdown for a request traced through a Node.js app, showing you the break down in time spent waiting on the file system versus routing:
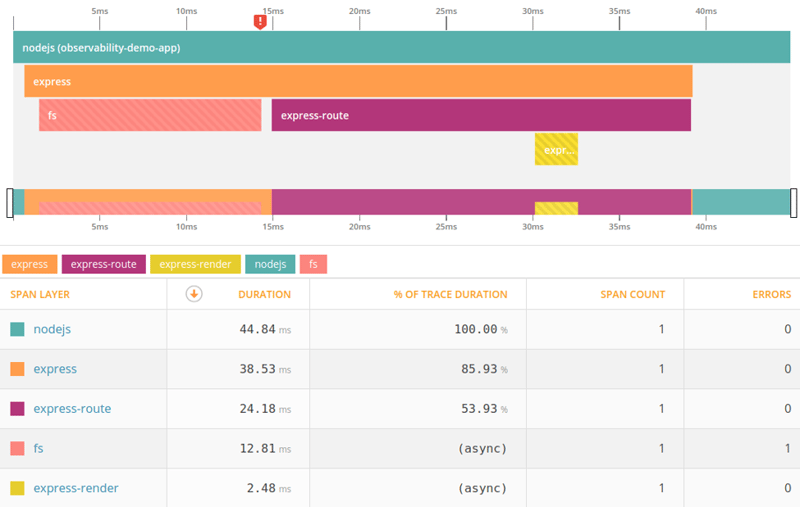
Tracing a Node.js request in SolarWinds AppOptics
Conclusion
You want managing your apps to be as painless as possible. There are several ways for you to monitor your apps with cloud providers, like Heroku, whether it’s through detailed infrastructure metrics or logs.


Top comments (0)