
The purpose of this tutorial is to show how to use ChartJS in React. In this tutorial, a small activity logging system is created from scratch. Based on the activity logged and hours spent, the user will be able to see the relevant chart formed on the screen. At the end of this tutorial, learners will get the basic understanding of ChartJS with React.
Demo
https://harshilparmar.github.io/React-Chart-Tutorial/
Table of contents:
- How will it work?
- Prerequisites
- Development
- Summary
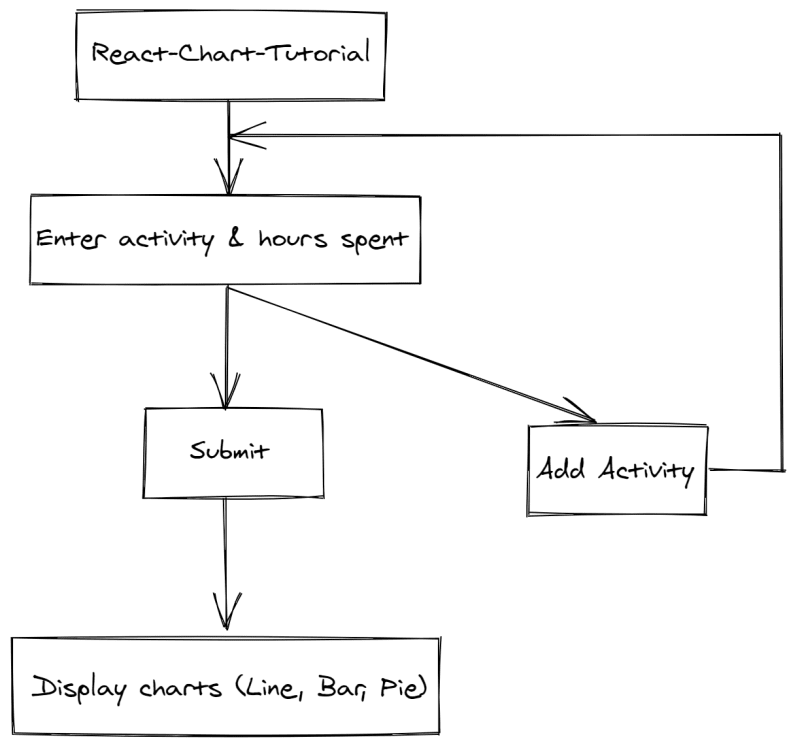
How will it work ?
The app will work according to given steps,
- Enter activity & hours spent
- Press Submit or Add another activity
- Charts will be shown(based on the activity & hours logged)
Flow of the web application is shown below:
Prerequisites:
To develop the Activity Logging System, we need to use few things.
Those are,
- Install Node
- Install VSCode
- Install React
- Install Chart
- Install Bootstrap (optional)
Let’s walk through each of them,
Download Node:
To download nodeInstall VSCode:
You can visit here to download VSCode according to your OS.-
Install react:
To install react on your machine, please run
npx create-react-app my-app
,You can visit here for official documentation.
-
Install Chart-js:
npm install react-chartjs-2 chart.js
You can visit here.
-
Install Bootstrap:
npm i bootstrap
You can visit here.
Development:
Folder Structure

Styling in React
There are various technics to style react application.We have used CSS Modules style.
There is a separate style file for each component component-name.module.css.
We can easily use that by importing them in js/jsx file and access that by className={styles.form}.
For more details,you can visit below links:
- https://medium.com/@dmitrynozhenko/9-ways-to-implement-css-in-react-js-ccea4d543aa3
- https://create-react-app.dev/docs/adding-a-css-modules-stylesheet/
Form component (Form.jsx)
Form in React
To make form in react, we have to make states which store local values and change it according to user-inputs.
For Function component we can use useState hook to make state.
const initialState = {
  dailyData: [
    {
      activity: "",
      timeSpent: 0,
    },
  ],
  chartLabels: [],
  chartData: [],
  chartColot: [],
};
By following above code snippets, we can initialize state.
const [state, setstate] = useState(initialState);
Here initial state will become initial value for our form field.
{state.dailyData.map((data, index) => (
          <Fragment key={index}>
            <div className="row">
              <div className="col">
                <input
                  type="text"
                  name="activity"
                  value={data.activity}
                  className="form-control"
                  onChange={(e) => onChange(e, index)}
                  placeholder="Activity"
                />
              </div>
              <div className="col">
                <input
                  type="number"
                  name="timeSpent"
                  value={data.timeSpent}
                  className="form-control"
                  onChange={(e) => onChange(e, index)}
                  placeholder="Time Spent"
                />
              </div>
            </div>
            <br />
          </Fragment>
        ))}
There are two fields in our form:
- Activity
- Time spent during that activity (in hour)
Each field has value property which is linked to state for showing current value of state in a form.
const onChange = (e, index) => {
    let { name, value } = e.target;

    let updatedState = [...state.dailyData];

    updatedState[index][name] = value;

    setstate((previousState) => {
      return {
        ...previousState,
        dailyData: [...updatedState],
      };
    });
  };
Onchange event of form will be handle by onChange handler.It will take event object and index of current changed activity.
For that we can use setState method.
For setting state we have to extract name and value from event object.
Here updatedState is temporary variable for mutating state.
For more details,you can visit: https://reactjs.org/docs/forms.html
Add Dynamic form field
       <button
          type="button"
          style={{ marginRight: "25px" }}
          name="addNew"
          onClick={addExtraField}
          className="btn btn-outline-success"
         >
          Add Activity
       </button>
To add an extra activity field we have to click a button which will add a new field to current form.
const addExtraField = (e) => {
    let extraActivity = [
      ...state.dailyData,
      {
        activity: "",
        timeSpent: 0,
      },
    ];

    setstate((previousState) => {
      return {
        ...previousState,
        dailyData: [...extraActivity],
      };
    });
  };
On every onClick event, addExtraField method will be called and set state after pushing new property to dailyData array.
Pass data to Chart
To pass current data to chart, we have to convert data in a specific format (array).
For that we use submit button to convert current state data to specific format. On every submit button click onSubmit method will be called.
const onSubmit = (e) => {
    e.preventDefault();
    let chartLabels = state.dailyData
      .map((data) => {
        return data.activity;
      })
      .filter((e) => e);
    let chartData = state.dailyData
      .map((data) => {
        return parseInt(data.timeSpent);
      })
      .filter((e) => e);

    setstate((previousState) => {
      return {
        ...previousState,
        chartData: chartData,
        chartLabels: chartLabels,
      };
    });
  };
Here, we have to convert state object to array using map method of array.
And after that we have to set that data to current state.
For passing data to chart component we have to check data availability for that we have to use conditional rendering.
{state.chartData.length && state.chartLabels.length ? (
        <Chart {...state} />
      ) : null}
Chart will only be rendered if there is a proper data to be passed to the chart.
For more details,you can visit: https://reactjs.org/docs/conditional-rendering.html
Chart Component (Chart.jsx)
To make charts, we have to use react react-chartjs-2 which is wrapper for Chart.js.
For this tutorial we will make three types of charts Line,Pie,Bar.
For more details,you can visit below links:
In every chart we have to pass prop object.
<Line
          data={{
            labels: props.chartLabels,
            datasets: [
              {
                data: props.chartData,
                label: "Activity",
                borderColor: "#3333ff",
                fill: true,
                backgroundColor: "#CAA6DB",
              },
            ],
          }}
        />
Here labels are those activities which we have been passed from Form component.
Datasets have various properties in which data property take data which we have to plot on chart.
For more details,you can visit below links:
- https://github.com/jerairrest/react-chartjs-2#properties
- https://www.newline.co/@dmitryrogozhny/quick-introduction-to-displaying-charts-in-react-with-chartjs-and-react-chartjs-2--a85b4e2e
To convert This chart to Bar chart we simply have to import Bar chat from react-chartjs-2 library.
<Bar
        data={{
          labels: props.chartLabels,
          datasets: [
            {
              data: props.chartData,
              label: "Activity",
              borderColor: "#3333ff",
              fill: true,
              backgroundColor: colorPicker.map(() => colorPicker[Math.round(Math.random() * 2)])
              ,
            },

          ],
        }}
      />
And same for pie chart
<Pie
        data={{
          labels: props.chartLabels,
          datasets: [
            {
              data: props.chartData,
              label: "Activity",
              borderColor: "#3333ff",
              fill: true,
              backgroundColor: colorPicker.map(() => colorPicker[Math.round(Math.random() * 2)])
              ,
            },
          ],
        }}
      />
For other examples of chart you can refer
http://jerairrest.github.io/react-chartjs-2/#/
Here colorPicker is an array which we are using to generate random colors for charts colorPicker.map(() => colorPicker[Math.round(Math.random() * 2)]).
Summary:
In this tutorial, you learnt how to show data in the form of charts using react.
Points covered:
- Add new input fields to react app dynamically.
- You can customise the look and feel of charts.
- Real time data representation in form of charts.
- Give random colors to the charts.
- Styling of input fields and buttons using Bootstrap.
Future scopes:
- You can create charts for large data sets using react.
- You can create a Task Management System for an organization/school/universities.
- Customise charts to represent data in a more visually appealing way.
Motivation behind the tutorial
I and my friend (Kathan Trivedi) had taken part in the Facebook Community challenge 2020 https://developercircles2020.devpost.com/ .In which we had to make a basic tutorial about any facebook technology.
Hope It helps.


Latest comments (10)
Thanks for making a clear and well-documented tutorial. Super helpful!
I glad you liked it 😊
What are your thoughts on using react wrapper vs using chartjs directly?
Sorry for late reply @phutngo. Sorry I don't have an idea regarding React wrapper.
This is amazing. I was always curious about how charts works from scratch? This article is definitely helpful.
I glad you like it 🙌
Nice article 👍
To get highlighted code in Markdown you can do like this:
Thanks...!! I'm glad you liked it 😀 I will use that markdown in next article.
There is also an Editor Guide for more comprehensive examples (embeding youtube, codesandbox etc) you could check out~
Thanks !!!