Analytics engineering: a new paradigm to data extraction and manipulation for analysts and data scientists
One of the main component of our jobs as analysts/data scientists is to write SQL. In order to find insights and generate value we query databases several times a day. And as data is messy, poorly documented and sometimes even wrong or missing, writing SQL becomes a time consuming endeavor and an on-going iterative process. Often we also have to repeat the same analysis and data extraction process over time to answer similar business needs. We always swear we are someday going to automate these processes with the help of some beautiful Python script but never end up doing it by lack of time (I know, I've been there). Or sometimes we don't have the data in the format we need and have to ask the database engineers to prepare specific tables for us, meaning more delays and unhappy business stakeholders. Before I present you with a solution and concrete examples, let's highlight the main pitfalls of our SQL activities:
-
Lack of proper version control: scripts sleep in our computer with beautiful names like
analysis_finalv3.2_product.sql, and at best in a remote repository that's kind of maintained. - No automation: recreating an analysis is manual and time consuming.
- Poor collaboration: because our SQL is not optimal and partly hidden, other analysts can't access it and have to copy paste or reinvent the wheel.
- No testing: we don't really know if the data we queried 3 months ago is still valid or behaves the same way. Even worse, hidden bugs like duplicated rows could make our aggregate reporting inaccurate, hurting the business.
- No documentation: this bug in the data we have hardcoded in a personal script and not made available to others means the same report from the same data can return different numbers.
All of the above can create one of the worse situation you can encounter as a data scientist: a lack of trust in the data from business stakeholders who depend on your analysis to take informed decisions.
But what's the solution? I'm glad you asked because let me introduce you to the work of the analytics engineer. Behind this somewhat fancy title lies one of the core competency of any good data analyst/scientist: autonomy. I believe as data professionals we need to take ownership for our own data processing, from the raw data to the end result (a report, a visualization, or even machine learning). We must not solely rely on software engineers to do the dirty work for us. While it is extremely difficult to manage databases and we still need engineers to make sure the data is actually available and the infrastructure robust there is however a lot we can and should do by ourselves, even with messy, unorganized data. This is the T in ETL: we transform existing data into something actionable. Analytics engineering is therefore not a completely different discipline, it's simply an extension of our current skill set that makes us more independent. And the beauty of it is that we only need a working knowledge of SQL to get started. If you want to read more about the analytics engineer, head over here.
Introducing dbt
dbt (data build tool) is an open source python library that leverage the power of SQL to perform data transformation. It requires an existing data warehouse and from there allow you to write code (in SQL) that in turn gets compiled and finally run against your database. It therefore assumes more of an ELT structure where the Extraction and Loading of the data happens beforehand and leaves you with the Transform step. For more information read this. Let's now see how it works in practice. dbt is extremely rich in features so I'm going to cover the basics first in this post and expand in later articles for the more in-depth functionalities. Before we dive in let's highlight some of the benefits dbt provides:
Simplicity. As we will see it hides most of the complicated steps needed to create tables and allows us to focus on delivering value through data transformations.
Version control. No more copy pasting, business logic is centralized and shared across the organization.
Environment management. Managing different environments and accounts (dev, testing, staging, production) is a breeze through the use of profiles to access the database and schemas.
Automation. By using what dbt calls macros we can abstract functionalities and bits of SQL instead of repeating them in different places of our codebase. This makes us respect the DRY (Don't Repeat Yourself) principle and saves a lot of time and headaches.
Testing capabilities. The last but probably one of the most important. We data scientists and analysts don't usually test our SQL code because it's complicated to do so in an automated way. We usually just check a subset of our SQL result is ok and we call it a day. Small issues are hard to find (like duplicated rows, or a missing value there and there) but can have dire consequences. dbt provides testing tools out of the box. It's so important and useful I will dedicate a whole article to it later on. But if you already wanna read about it, check here.
Requirements
- Python 3, follow these instructions if you don't have it.
- Pipenv to manage Python dependencies. I wrote an introductory post about pipenv and the installation procedure is available in the Code Vault.
- dbt. Simply run the following in your project folder:
pipenv install dbt
- Finally, it's difficult to explain a new concept without a concrete example and visuals of what's happening. In this post I'll use a pet project of mine you can find and clone at this repo link. The idea is to create a small database of cards from the newly released game Legends of Runeterra made by the Riot company, and to create a new transformed table out of it for analysis purpose. You don't have to understand or even be interested in any of it to follow the steps I present below. Finally in parallel I created a database on AWS in order to host our data. You can't access it but I'll show you what's happening with screenshots.
Breaking down a dbt command & main concepts
In order to understand how dbt works we are going to break down its main command used to execute code and transform data inside your warehouse. Then for each concept we will review how it works and when it can be used, and in the end we will see it in action (through screenshots of code executed against my personal database). While dbt offers many features we won't cover for now, I hope that by the end of this article you'll understand how all of this works together and be able to get started by yourself (and with the help of dbt great documentation).
Here is a typical dbt command. don't worry if you don't understand any of it for now, simply remember that dbt takes raw data, applies your transformations, and materializes them into new tables or views:
pipenv run dbt run --profiles-dir=. --target=profile_dev --full-refresh --models region_keyword_distributions
And the below screenshot represents the usual dbt project structure that can be found in my pet project in explorer/dbt/ (you can generate the same structure by running dbt init [project-name] in a new folder):
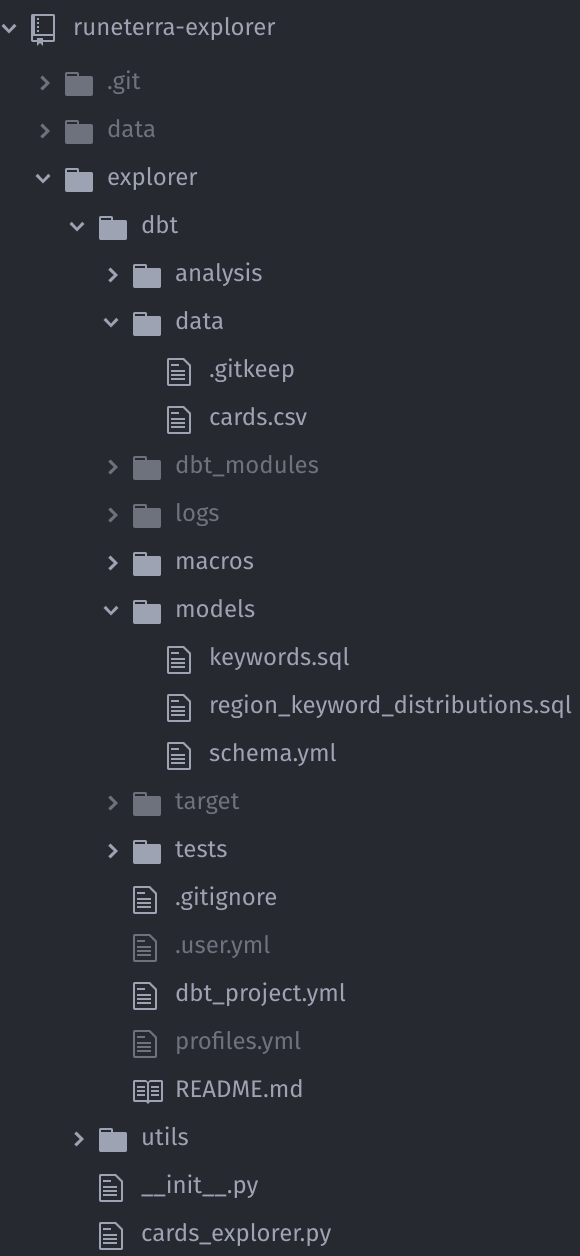
Note: for better understanding and clarity every file path I mention below is relative to the dbt folder (in short I omit the explorer/dbt part and assume we already are in this folder).
Targets and profiles
dbt uses targets located inside profiles to determine where our generated SQL will be stored. Simply put we ask dbt to send the result of our transformations to a specific database/schema. Targets and profiles are handled by profiles.yml. What is this weird .yml extension you are asking? dbt indeed uses YAML to handle configuration files like this one. YAML is a kind of json. The entire project is therefore a mix of .sql and .yml files. By the way, even though you can see this profiles.yml file in the above screenshot of the project structure, it's not available in the Github repository, because this file contains usernames and passwords. So except if you are using environment variables placeholders, never ever push this file to a remote Github repository. Seriously. Your IT department is going to be mad and we don't want this. Simply add it to .gitignore so it's ignored by git. This is how the file looks like:
  explorer:
    target: profile_dev
    outputs:
      profile_dev:
        dbname: XXXXX
        host: XXXXXXX.us-east-1.rds.amazonaws.com
        pass: 'XXXXXX'
        port: 5432
        schema: 'XXXXXX'
        threads: 4
        type: redshift
        user: 'XXXXXX'
This YAML file is what the --profiles-dir=. --target=profile_dev refers to in the dbt command above. It contains the database credentials for the profile_dev target that is part of the explorer profile, and which is also the default one as specified by the target key. In outputs you can have as many profiles as you want, which is often the case in a "real" setting: one for each of dev, unit tests, integration tests and production for instance. The first part --profiles-dir=. when executed in the dbt folder tells dbt to look for the profile file in . which means the current directory we are already in. You can change this depending where profiles.py file is located. If not specified it will look by default in ~/.dbt/ on your machine. However I prefer to have it as part of my project structure as it makes it easier to manager in production (but remember, do not push passwords remotely!). Last step, you need to specify which profile dbt should be using in dbt_project.yml under the profile key.
This may look a bit cumbersome to setup, and it's definitely overkill in my simple project example, but it really shines in a real production environment or collaborative project. The ability to have multiple targets and profiles is really helpful to manage environments as you can execute the same SQL across 2 different schemas (test and production for instance) by simply changing it in the command line.
Models and Macros
Models are the bread and butter of your dbt projects. This is where dbt is truly amazing because everything is a SELECT. You read it right, no need to write complex CREATE statements, DELETE records, or dropping tables. dbt handles it all for you. You can therefore focus on the parts that generate value: transforming data and answering business needs. Models live in the models folder, where dbt automatically finds them upon execution if not specified. Thus the --models region_keyword_distributions part of our original command is to tell dbt to execute the region_keyword_distributions model only. Leaving this argument empty automatically executes every model found in the models folder. In our example project, we have region_keyword_distributions located at models/region_keyword_distributions.sql. Models are .sql files and this is what it looks like:
  {{ config(materialized='table') }}

  SELECT
     k.keyword,
     c.region,
     COUNT(*) as region_cards_count,
     SUM(CASE WHEN c.keywords LIKE '%' || k.keyword || '%' THEN 1 ELSE 0 END) AS keyword_occurence,
     (SUM(CASE WHEN c.keywords LIKE '%' || k.keyword || '%' THEN 1 ELSE 0 END)::decimal / COUNT(*)::decimal)::decimal(4, 2) AS keyword_perc_of_total_cards
  FROM
      {{ ref('keywords') }} k
          CROSS JOIN {{ ref('cards') }} c
  WHERE
      keyword <> ''
  GROUP BY
      k.keyword,
      c.region
The first thing to notice is the header macro between {{ }}. A macro is a SQL snippet that behaves like a function. This is super useful because it allows us to repeat the same lines of SQL between files without copy pasting them. By concentrating these SQL snippets into one file we avoid mistakes more easily by having to modify only one file where this code appears. This post is an introduction so I won't cover macros in depth, but feel free to read about them here. This macro in our first line is part of the set of macros dbt offers out of the box. However more macros can be found here. These macros are awesome and allow for a lot of customization and automation. In order to install the dbt_util package, head over to the packages.yml file:
  packages:
    - package: fishtown-analytics/dbt_utils
      version: 0.2.3
In this .yml configuration file you specify the package location and the version. Then simply run pipenv run dbt deps to install it. Afterwards packages content can be found in dbt_modules.
Let's circle back to the config macro found in the first line of our model. It simply tells dbt we want the output of our SQL to be a table. Other options are view or ephemeral (ephemeral tables are used as a step to build another table and then are removed, like a CTE if you are familiar with the concept).
The second macro occurs in the FROM clause. {{ ref('keywords') }} tells dbt to query from the reference keywords table. Why not write it directly then? Because doing it that way allows dbt to understand the current model should be executed only when the keywords table has been created, which our current SQL query depends on. Same thing for the cards table with {{ ref('cards') }}. Dependencies between table are automatically handled this way. Our others models at models/keywords.sql and data/cards.csv (more on this type of model below) will therefore be executed first.
Incremental models
Remember above we mentioned that different materializations can be created by specifying it in the model header. In addition to table, view and ephemeral we already covered, one of the most useful feature of dbt is the possibility to create incremental tables. Instead of recreating a table from scratch incremental tables simply append the latest data to a table as specified. For instance if you process your revenue table once a day, you can only add yesterday instead of rerunning it from the beginning by using the incremental config argument. This is how the models/region_keyword_distributions.sql would look like as an incremental model if it ran daily and used an event_time column:
  {{ config(materialized='incremental') }}

  SELECT
     k.keyword,
     c.region,
     COUNT(*) as region_cards_count,
     SUM(CASE WHEN c.keywords LIKE '%' || k.keyword || '%' THEN 1 ELSE 0 END) AS keyword_occurence,
     (SUM(CASE WHEN c.keywords LIKE '%' || k.keyword || '%' THEN 1 ELSE 0 END)::decimal / COUNT(*)::decimal)::decimal(4, 2) AS keyword_perc_of_total_cards
  FROM
      {{ ref('keywords') }} k
          CROSS JOIN {{ ref('cards') }} c
  WHERE
      keyword <> ''

      {% if is.incremental %}

      AND event_time = DATEADD('day', -1, CURRENT_DATE)

      {% endif}

  GROUP BY
      k.keyword,
      c.region
dbt allows us to use if..else logic like in this example to specify that if the model is incremental, then only run yesterday's data. Pretty neat! Another thing you can try is having different if..else logic depending on the target you are using. This is incredibly useful when running a script in a unit test environment. I for instance typically use it this way at work (using the above example again):
  {{ config(materialized='incremental') }}

  SELECT
     k.keyword,
     c.region,
     COUNT(*) as region_cards_count,
     SUM(CASE WHEN c.keywords LIKE '%' || k.keyword || '%' THEN 1 ELSE 0 END) AS keyword_occurence,
     (SUM(CASE WHEN c.keywords LIKE '%' || k.keyword || '%' THEN 1 ELSE 0 END)::decimal / COUNT(*)::decimal)::decimal(4, 2) AS keyword_perc_of_total_cards
  FROM
      {{ ref('keywords') }} k
          CROSS JOIN {{ ref('cards') }} c
  WHERE
      keyword <> ''

      {% if target.name = 'unit_tests' %}

      AND event_time = DATEADD('day', -3, CURRENT_DATE) OR
      event_time = DATEADD('day', -63, CURRENT_DATE)

      {% endif}

  GROUP BY
      k.keyword,
      c.region
This logic simply tells dbt upon execution that if we are in a unit_tests context, only run this SQL for 2 specific days (3 days ago and 63 days ago) as usually we want tests to be fast and not run on the entire data. You can add a lot of customization this way and automatically handle environments constraints.
Finally the --full-refresh argument is another useful dbt trick when running incremental models: by specifying --full-refresh we tell dbt to ignore the fact it's incremental and run it from scratch. It's often used if the data has changed or we modified our table but again it's all controlled with the command line without the need to manually change the code.
Seeds
Before we take our code for a test ride there is a last feature we need to see: seeds. dbt seeds are simply static .csv datasets that we can upload to our database as tables. This is great for files that don't change very often but you still need as part of your ETL. An example for a game would be a design document specifying some immutable characteristics (like a character name and attributes). This is exactly what can be found in our example project data folder in the data/cards.csv file. This file contains every card characteristics. This doesn't change very often (only when the dev team releases update) and is a good use case for a seed model. To run this type of model, use the following command, using --show to display a preview of the table:
pipenv run dbt seed --profiles-dir=. --show

dbt in action!
Now is the fun part! Let's use our newly acquired knowledge and watch how dbt works within our pet project. We are going to execute each command in order until all our transformed data is in. Remember, everything is executed in the dbt folder (adapt your path if needed):
Install dbt dependencies
pipenv run dbt deps --profiles-dir=.
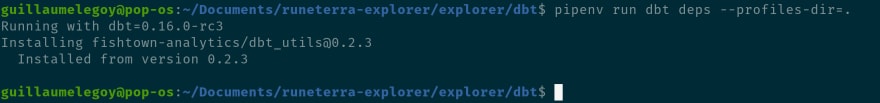
We successfully installed the dbt_util library. You can navigate to dbt_modules and you'll discover that a dbt_util folder has been created, inside of which everything we might need like macros has been imported.
Run our seed model
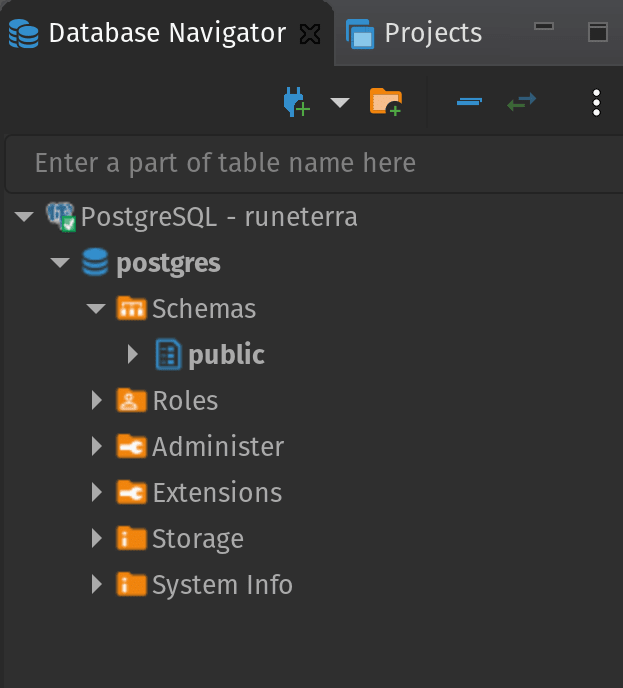
below you can see what our database looks like at this point. It's pretty empty so we need to feed it some data, in our case the .csv seed model containing cards information we mentioned above. At work this raw data might already exist and you could directly create models, but for a personal project you will need to import data first, either as a seed, or if you want to take it to the next level a daily/hourly import of data (like financial data for instance).
Let's run our seed model:
pipenv run dbt seed --profiles-dir=.
The result is successful:
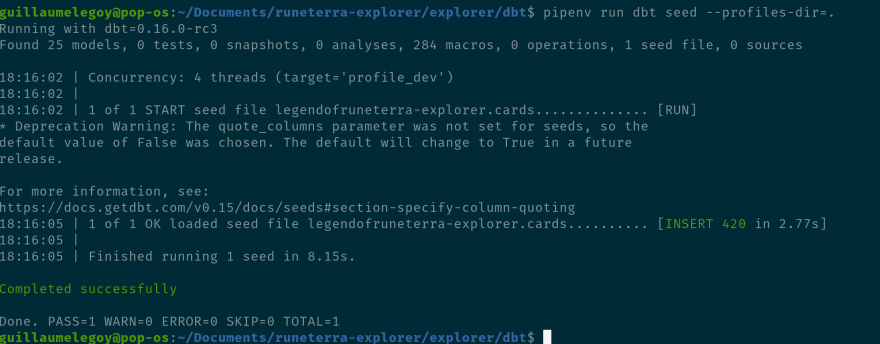
Here you can see the following info is displayed: Concurrency: 4 threads (target='profile_dev'). You can set up the number of thread in your profiles.py file depending on your warehouse capacities (more info here). dbt also informs us it's running using the profile_dev target. This is the default one we setup as part of our profile if you remember, but specify it in the command if you have multiple environments and targets using the --target= argument.
Finally if we check the database we can see the table has been created, awesome! You can by the way observe the legendofruneterra-explorer schema was automatically created. Make sure you have the right to do that in your project (especially at work where permissions between user accounts can differ and can be pretty complicated to setup).
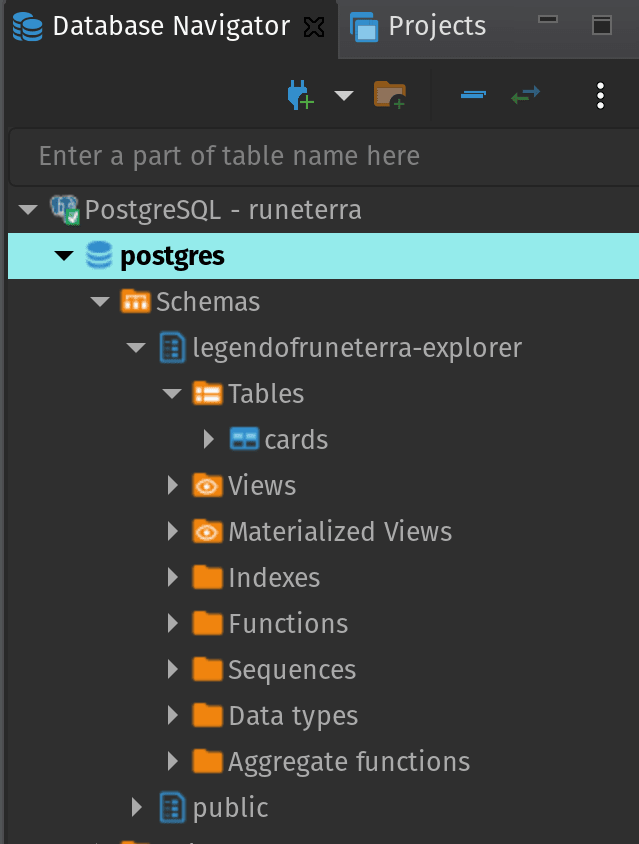
Transform our data
The last step is where the magic happens! We now transform our data to suit our business needs and analysis constraints, or in our case a simple table based on our collection of cards found in the cards table:
pipenv run dbt run --profiles-dir=.
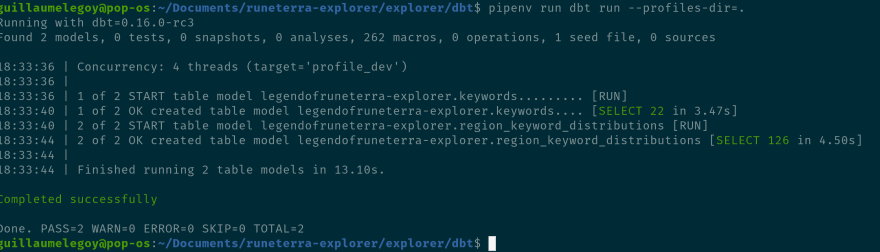
As we've seen earlier, dbt automatically finds out that keywords should be executed before region_keywords_distribution. And the 2 tables are now available in the database:

That's it, data is now in an actionable format and is ready to be queried into reports or visualization. I hope that with this introduction you are now able to transform your own data and improve your autonomy at work as a data scientist / analyst. Stay tuned and suscribe to my newsletter for more articles on the subject. I aim to post about advanced usage of dbt later on.
Happy coding!
If you want top keep up to date with my latest posts, don't hesitate to follow my Twitter or subscribe to my free newsletter.


Top comments (0)