
The first step to start doing data analysis in Python is to import your data from a certain source (in my first post we saw that pandas is great for data analysis). In this post I'm going to show you how to load files into pandas data structure (dataframes) and then we'll check how we can print the whole dataframe or a sample of the data, filter specific values and select specific columns and rows, besides append and delete them. In the end we'll check the logic sequence of pandas operations.
This second post is different from the first one. In the first one we learned the theoretical stuff. On the other hand, this post will be more practical so I would appreciate if you code along with me. If you have any questions please feel free to use the comments section below.
Note [1]: I made a Jupyter Notebook available on my GitHub with the code used in this post.
Before we start
This is a pandas tutorial, so the first step is to import it by typing the following in your Python runner:
import pandas as pd
You may have noticed that I didn't just import pandas but I also gave an alias to it. Then, everytime I need to use the pandas library I can refer to it as pd.
Reading a file
What is your file extension? First of all you need to know what is the file type you'll work on. It's common to have data in .csv (Comma Separated Value) files. But keep in mind that you can work with other file types, like .xls, .xlsx, .txt, .json, .html, and so on.
To analyse the data, the first step is to import it from the file into a dataframe. To do this is easy with pandas since it provides functions for each file type, as you can see here. But in this post we're working with .csv files because it is one of the most common or maybe the most common.
The second important thing to know is where is your file, i.e. you need to know what is the path directory of your file to allow pandas to find it.
Knowing this, let's download our working file.
!wget https://raw.githubusercontent.com/gabrielatrindade/blog-posts-pandas-series/master/restaurant_orders.csv
Now, open your file and make observations on it, like: Is there a head, i.e. the first line represents the column names? What is the column separator? This two questions are important to import the file into a dataframe. To do that use the read_csv() function:
pd.read_csv('restaurant_orders.csv', delimiter=',')
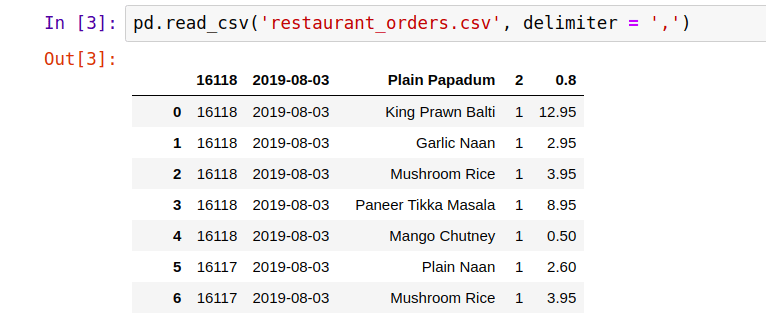
As you can see the file has no head and pandas will considerate the first line a head by default, thus let's add the column names to it.
column_names = ['order_number', 'order_date', 'item_name',
                'quantity', 'product_price']

pd.read_csv('restaurant_orders.csv', delimiter=',', names=column_names)

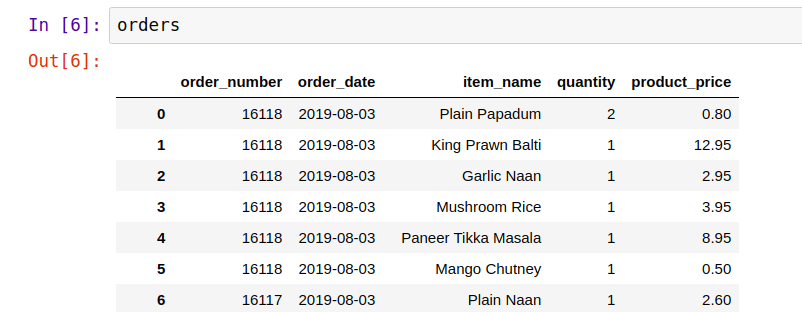
Now let's store our dataframe into a variable because we'll work a lot with it.
orders = pd.read_csv('restaurant_orders.csv', delimiter=',',
                     names=column_names)
Now, you can see the whole dataframe through the variable we just introduced.
orders

Note [2]: Did you notice how this file has so many rows (observations)? To be exact there are 74818 rows. Wow! And we are going to work with this dataset.
Before we move on, pay attention to our dataset and try to understand what it means. It represents orders from Indian takeaway restaurant in London, UK. Each row is a single product within the order, i.e. one order can have more than one row. There are 5 columns: order_number, order_date, item_name, quantity, and product_price. I believe that the names are self explanatory, but if you have any questions about the dataset, let me know through the comments.
You also can verify the type of orders variable. As we know, it's a DataFrame object.
type(orders)

Basic DataFrame operations
Printing samples
head and tail
These functions will print the first and last rows, respectively. They are commonly used to see a sample of Series or DataFrame object. By default they will print five rows, but you can pass a number as an argument.
orders.head()

orders.tail()

Sample
It's one more function to have a sample of Series or DataFrame. However you need to pass the number as an argument and then it will sort the rows randomly.
orders.sample(5)

Selecting specific rows and columns
Other ways to get a subset of your dataframe is by selecting a specific set of rows and columns you want.
Rows
To select rows you only need to pass the rows interval between brackets.
It's important to highlight that pandas is based-indexing zero, i.e. the first element is zero which is included, and the last index is excluded.
orders[0:7]

But if you don't want to specify the begin or the end of your subset, you can simply omit this information. It will consider the first index or the last index for omitted ones, respectively.
orders[:6]

Columns
To select columns, if you want to get a DataFrame object, use double brackets.
orders[['item_name']]

But if your need is to have a Series object, there are two ways to access it.
orders['item_name']

orders.item_name

As you'll see at the end of this post, you can chain operations and it will follow the linear logic. So you can do something like this.
orders[['item_name']][:6]

But I will explain it in more details in the end.
.iloc, .loc
The selection of rows and columns also can be made by some attributes, such as .iloc and .loc. The general syntax for these attributes is dataframe.attribute[<row selection>, <column selection>]. In these cases you can omit the <column selection>, but you need to inform the row ones. I am going to show you some examples.
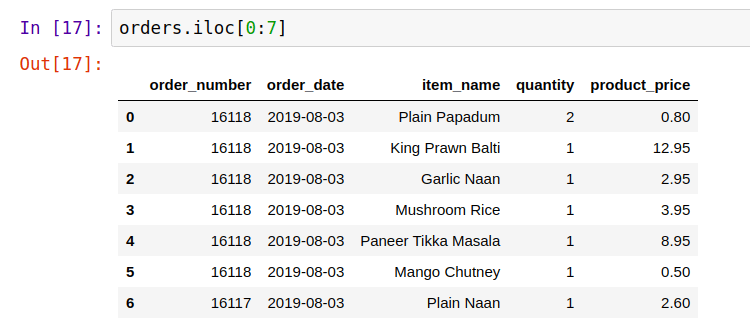
.iloc is based on position.
orders.iloc[0:7]
orders.iloc[:, 2:4]

orders.iloc[-1]
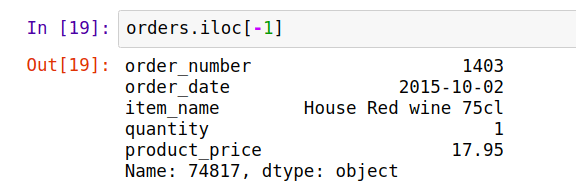
Note [3]: Negative index will consider from the bottom to the top. Then, in this case it returns the last row. Ah, and it works in the same logic to columns as well.
Note [4]: .iloc returns a pandas Series when one row is selected, and a pandas DataFrame when multiple rows are selected or if any column in full is selected. If you want a DataFrame use double brackets.
.loc is based on label. However our label for rows was not changed so by default it is the index.
orders.loc[0:7, ['order_number', 'item_name']]

orders.loc[[1, 3, 5], ['order_number', 'item_name']]

Filtering by specific values
What if you need to select rows that contain specific values? Let's say we want to select only the order 16118 to see the items of it.
orders[orders.order_number == 16118]

In this way we can see all the items listed for this order. But how it works? First pandas check the condition between brackets orders.order_number == 16118. If you just compile this part, it returns a pandas Series object with Boolean value where each one is the result of the condition for all rows in the dataframe. Then, in the second part orders[...] pandas prints just the correspondent rows for values that were True.
It works like a 'where' clause in SQL.
One more example is to filter by day.
orders[(orders.order_date == '2019-08-03') |
       (orders.order_date == '2019-08-02')]


Note [5]: In these examples I'm using the two ways to access a column in a dataframe. As I explained at the beginning of this post, I can access column using brackets or dot notation.
As you probably noticed we can use some logical operators (&, | to represent 'and', 'or') as well as comparison operators (==, !=, <>, <, >, <=, >=) in our conditions.
Adding rows and columns
In order to not compromise our dataframe, for this subsection and the next one, we'll create a copy of our dataframe and then work from it.
orders_copy = orders.copy()

orders_copy.head()

Note [6]: To create a copy you need to use copy() function. If you just assign orders to orders_copy you are creating a reference to it which means that changing orders_copy will change orders too.
Rows
To add new rows to a dataframe is easy. We can use the append() function and as an argument we pass a Series list, or Dictionary to represent the row.
Pay attention about the type of the values, they don't need to match with the data types of each dataframe column, but you don't want to mess up your dataframe and consequently your analysis. So be sure that you are adding the right values in the correct columns.
orders_copy = orders_copy.append(
    pd.Series([123456, '2019-08-04', 'Product Test', 4, 1.00],
              index=orders_copy.columns),
    ignore_index=True)

orders_copy.tail()

It's also possible to do it by using the .loc attribute directly. Although it's not considered a good practice since you should rely more on the object API instead of changing directly their internal state.
row = [12134567, '2019-08-04', 'Product Test', 4, 1.70]
orders_copy.loc[len(orders_copy)] = row

orders_copy.tail()

Columns
There are some ways to add columns in a dataframe.
You can do that using list, but in this case you need to assign for each row a value. Then, in our case we'd need to create a list with 74820 values. In general we do this by assigning a function or an expression to the column. But, if you want to assign the same values for all rows, you can do this just like the example below.
Let's say that all items had a discount.
orders_copy['discount_pct'] = 10

orders_copy.head()

It doesn't look so useful, does it? But in our case we'll use it to give the discount for each product price.
So let's see the interesting part. You can use an expression to fill the column. And here we're going to create the column that represents discount through price.
orders_copy['discount_price'] = (orders_copy['product_price'] *
                                 (orders_copy['discount_pct'])) / 100

orders_copy.head()

So all the discount_price column is representing the discounted value for each product (row).
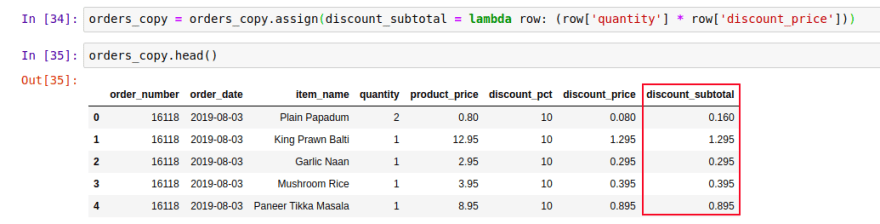
You can also add columns using assign() function.
Let's create the total discount taking into account the quantity of products.
orders_copy = orders_copy.assign(
    discount_subtotal=lambda row: (row['quantity'] * row['discount_price']))

orders_copy.head()
One more way to do add columns is through the apply() function. In this case you'll create a column using a function that will be applied for each row. Like the examples above.
orders_copy['subtotal'] = orders_copy.apply(
    lambda row: (row['quantity'] *
                 (row['product_price'] - row['discount_price'])), axis=1)

orders_copy.head()
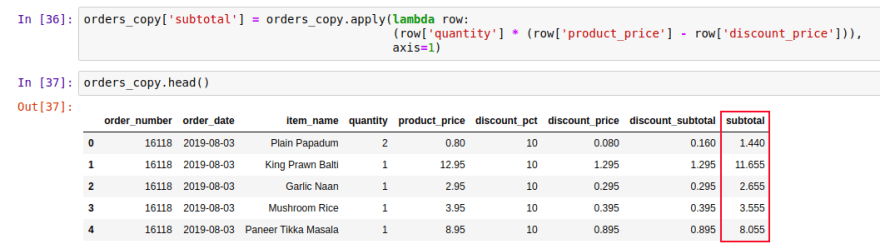
The axis=1 means that we are working with column.
Deleting rows and columns
It's important to evaluate the decision of deleting something before doing it. You can do some filters to check if it's really what you want to delete. Here we are working with the dataframe copy, so we don't need to worry about that.
To both, rows and columns, we use drop() function.
Row
Let's delete the row that we added. But before, let's check the row index.
orders_copy[orders_copy.item_name == 'Product Test']

Now we know that the index is 74818. Let's drop it.
orders_copy = orders_copy.drop(orders_copy.index[74818])
Check if it was deleted.
orders_copy[orders_copy.index == 74818]
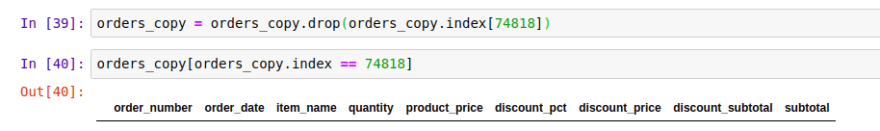
It doesn't exist anymore.
Column
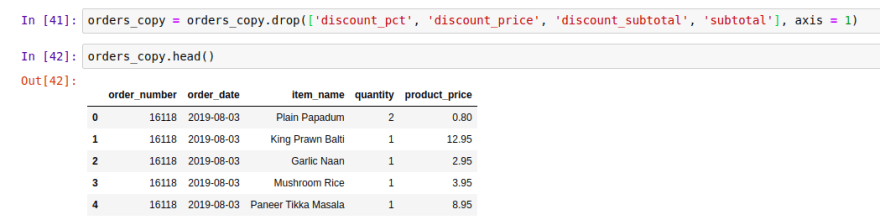
In the same way, let's delete the columns that were created.
orders_copy = orders_copy.drop(['discount_pct', 'discount_price',
                                'discount_subtotal', 'subtotal'], axis=1)
The axis=1 refers that it's a column, not a row.
Check it is was deleted.
orders_copy.head()
Linear logic
The pandas logic is very linear (compared to SQL, for example), you can chain operations one after the other. The input of the latter function is the output of the previous one. Let's see some examples.
Get the first 3 different products bought at '2019-08-03' . Consider that the dataset is sorted by the orders. Print only the product name.
orders[orders.order_date == '2019-08-03']['item_name'].head(3)
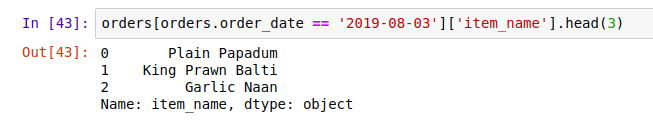
First we filtered by the orders at '2019-08-03', then we selected just the product name column and finally we printed the first 3 products.
Get the 3 last different products which was buying. Print the product name and the quantity.
orders[['item_name','quantity']].tail(3)

As you can see we selected the right columns and then we applied the tail function to get the last 3. Similarly we would first apply the tail function and then select the columns. The output would be the same.
And finally, let's print the five last orders that happened on '2019-08-03' and have a 'Plain Papadum' on it.
orders[(orders.order_date == '2019-08-03') &
       (orders.item_name == 'Plain Papadum')].tail()

As you can see, in this case we used the & operator to filter our dataset.
Wrapping up
In this post we learned how to create a dataframe by reading a file. We saw how it is easy with pandas. We saw the main information we need to know to read a file, such as file extension, how it is organized, and the file path directory.
We also learned about dataframe basic operations. Such as print sample of our dataframe; select, append and delete rows and columns; and filter specific rows through conditions.
Finally, I showed to you about how to do chained operations in only one line of code, explaining about the pandas linear logic.
In the next post we'll see about aggregation and grouping. How we can apply some interesting methods, like for example sum(), mean(), avg(), and grouping our dataset by a collection of elements in common. I'm looking forward to show you interesting things we can do with pandas.
Dataset original reference: Takeaway Food Orders


Top comments (0)