You are a software engineer working for a small software vendor. One day, your company receives an email from a big client, A.C.M.E., requesting a proposal for a new web application. It requires the application to be written in ReactJS and includes some screen mockups featuring spreadsheets with Excel import/export capabilities.
You have to create the prototype web application first. As stated in the proposal, the success of that prototype will decide whether your company will stay or not in the competition for a very lucrative contract.
After hours of building the prototype, you feel confident that all screens satisfy the specification and that the prototype will be ready by the deadline. But, after rereading the client request, your confidence suddenly collapses; you have misread the part about spreadsheets.
They can’t be simple grids with editable fields as you initially thought. They must have not only the same look and feel but also the behavior as Excel spreadsheets. What would you do now?
React and Spreadsheets
Let's look at the client's motivations for the request. React is currently the most popular front-end library/framework. Its rising adoption in the last few years has been carried out by everyone from IT students to big business companies. React is increasingly being used in corporations that invest heavily in technology, productivity suites, and tailor-made line-of-business apps.
Corporate users work not only with specialized business applications but also with general-purpose tools like spreadsheets, charts, and reporting apps. While adopting ReactJS, companies often look for third-party vendors to provide productivity tools with features familiar to their employees or clients. However, these users often have to work with apps that don’t deliver the user experience expected for their daily needs.
Using Spreadsheet Components
SpreadJS provides React developers with spreadsheet functionality that would be difficult to find anywhere else. There are so many line-of-business apps that would benefit from having an interactive spreadsheet embedded instead of just using a boring, static table — yet those boring tables are what business apps end up with because developers don't realize something better is possible.
In this walkthrough, we assume that you already have basic knowledge of ReactJS, and we're going to evolve the static table approach by showing how to take an existing React app and add a spreadsheet. Then, we'll take advantage of the built-in Excel import/export functionality of SpreadJS to make the app even better.
Powerful Calculation Engine With 450+ Functions
This high-speed, optimized engine adds computing power to even the most complex formulas without dragging down your apps, includes more functions than any other spreadsheet component, and supports custom functions.
Import/Export Excel Files in a JavaScript Spreadsheet
No JavaScript spreadsheet is complete without full Excel import/export support! Import your Excel spreadsheets and lose little functionality—and then export your SpreadJS spreadsheet to XLSX.
Visualize Data with Charts and Sparklines
Offer insight into your data with interactive charts and sparklines. With most Excel charts, interactions, and animations, your dashboards and analytical spreadsheets will come to life.
Built-in Globalization
Select from available cultures or create your own custom culture and adjust date masks, languages, number separators, currencies, etc.
Data Presentation Controls
Take advantage of tables, filtering, conditional formatting, and shapes to offer an expanded Excel-like experience.
Adding SpreadJS to Your React App
You can see the static table app running live on StackBlitz, and the demo source can be found here.
If you want the full-fledged app with SpreadJS already added, download this sample.
Once you've done that, open a terminal, navigate to the directory where you cloned the repository, and run:
> npm install
Now you’ll see the updated app in action.
- Static Code
- From Static to SpreadSheet
- Spreadsheet With Reactive Binding
- Adding Excel Import/Export Features
Step 1: Static Code

The front end of this application was built on ReactJS and structured in components created with JSX syntax, a combination of JavaScript and HTML code. The application was created using the syntax of functional components. This approach allows us to avoid writing classes, which could make components more complex and difficult to read.
The Dashboard stands on top of the JSX component hierarchy. It renders HTML content and maintains the application state, originating from a file with dummy JSON sales data.
Each of the child components is responsible for rendering its contents. Since only the Dashboard holds the app state, it passes the data down to each child component through props.
    import React, { useState } from 'react';
    import { NavBar } from './NavBar'
    import { TotalSales } from './TotalSales'
    import { SalesByCountry } from './SalesByCountry'
    import { SalesByPerson } from './SalesByPerson'
    import { SalesTable } from './SalesTable'
    import { groupBySum } from "../util/util";
    import { recentSales } from "../data/data";
    export const Dashboard = () => {
        const sales = recentSales;
        function totalSales() {
          const items = sales;
          const total = items.reduce(
            (acc, sale) => (acc += sale.value),
            0
          );
          return parseInt(total);
        };
        function chartData() {
          const items = sales;
          const groups = groupBySum(items, "country", "value");
          return groups;
        };
        function personSales() {
          const items = sales;
          const groups = groupBySum(items, "soldBy", "value");
          return groups;
        };
        function salesTableData() {
          return sales;
        };
        return (
            <div style={{ backgroundColor: '#ddd' }}>
                <NavBar title="Awesome Dashboard" />
                <div className="container">
                    <div className="row">
                        <TotalSales total={totalSales()}/>
                        <SalesByCountry salesData={chartData()}/>
                        <SalesByPerson salesData={personSales()}/>
                        <SalesTable tableData={salesTableData()}/>
                    </div>
                </div>
            </div>
        );
    }
As you can see, data from the SalesTable component displays the individual sales obtained directly from the data in the JSON file. First, the totalSales, chartData, and personSales functions take in raw sales data. Then they provide the calculations for the TotalSales, SalesByCountry, and SalesByPerson panel results, respectively.
The JSX syntax allows you to return HTML content directly from code without having to concatenate strings. We can see how the props are inserted into the HTML segments inside curly braces and passed to each component as static data. The SalesTable panel at the bottom of the page is responsible for statically displaying sales details.
In the next step, you will need to replace the SalesTable static grid with an interactive worksheet.
Step 2: From Static to SpreadSheet
Before writing any line of code, we must first install GrapeCity’s Spread.Sheets Wrapper Components for React. Just stop the app, and run these two commands:
    > npm install @grapecity/spread-sheets-react
    > npm start
Before using SpreadJS, you must modify the SalesTable.js file to declare the imports of the GrapeCity components. These Imports will enable access to the SpreadSheets, Worksheet, and Column objects of the SpreadJS library.
 import React from 'react';
    import { TablePanel } from "./TablePanel";
    // SpreadJS imports
    import '@grapecity/spread-sheets-react';
    /* eslint-disable */
    import "@grapecity/spread-sheets/styles/gc.spread.sheets.excel2016colorful.css";
    import { SpreadSheets, Worksheet, Column } from '@grapecity/spread-sheets-react';
Besides, a SpreadJS worksheet doesn't work properly without a few basic settings, so let's create a config object to hold the worksheet parameters.
 export const SalesTable = ({ tableData } ) => {
        const config = {
            sheetName: 'Sales Data',
            hostClass: ' spreadsheet',
            autoGenerateColumns: false,
            width: 200,
            visible: true,
            resizable: true,
            priceFormatter: '$ #.00',
            chartKey: 1
        }
First, we'll have to eliminate the JSX code that renders the static panel inside the SalesTable component:
   return (
        <TablePanel title="Recent Sales">
            <table className="table">
                <thead>
                <tr>
                    <th>Client</th>
                    <th>Description</th>
                    <th>Value</th>
                    <th>Quantity</th>
                </tr>
                </thead>
                <tbody>
                {tableData.map((sale) =>
                (<tr key={sale.id}>
                    <td>{sale.client}</td>
                    <td>{sale.description}</td>
                    <td>${sale.value}</td>
                    <td>{sale.itemCount}</td>
                </tr>))}
                </tbody>
            </table>
        </TablePanel>
    );
By eliminating this code block, we end up with the TablePanel alone, a generic UI wrapper we use in each component.
   return (
        <TablePanel title="Recent Sales">
        </TablePanel>
    );
At this point, we can now insert the SpreadJS SpreadSheets component inside the TablePanel. Note that a SpreadSheets component may contain one or more Worksheets, just like an Excel workbook may contain one or more worksheets.
   return (
        <TablePanel key={config.chartKey} title="Recent Sales">
            <SpreadSheets hostClass={config.hostClass}>
                <Worksheet name={config.sheetName} dataSource={tableData} autoGenerateColumns={config.autoGenerateColumns}>
                    <Column width={50} dataField='id' headerText="ID"></Column>
                    <Column width={200} dataField='client' headerText="Client"></Column>
                    <Column width={320} dataField='description' headerText="Description"></Column>
                    <Column width={100} dataField='value' headerText="Value" formatter={config.priceFormatter} resizable="resizable"></Column>
                    <Column width={100} dataField='itemCount' headerText="Quantity"></Column>
                    <Column width={100} dataField='soldBy' headerText="Sold By"></Column>
                    <Column width={100} dataField='country' headerText="Country"></Column>
                </Worksheet>
            </SpreadSheets>
        </TablePanel>
    );
As a finishing touch, we'll add these lines below to the App.css file to fix the Spreadsheet dimensions so that this component takes up the full width of the bottom panel and the appropriate height for the Sales Dashboard page.
    /*SpreadJS Spreadsheet Styling*/
    .container.spreadsheet {
        width: 100% !important;
        height: 400px !important;
        border: 1px solid lightgray !important;
        padding-right: 0;
        padding-left: 0;
    }
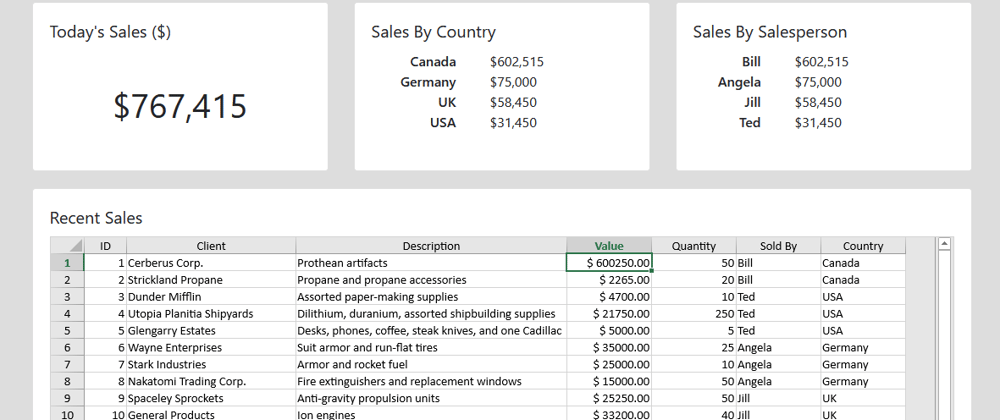
And… voilà! This gives us the stunning spreadsheet below:

Note how the SpreadJS worksheet gives us the same look and feel as would an Excel spreadsheet.
Within the Worksheet component, we can see the Column components, which define the characteristics of each column, such as width, binding field, and header text. We've also added currency formatting to the sales value column.
Like the old static table, the new SpreadJS Spreadsheets component receives data from the props passed down from the Dashboard. As you can see, the spreadsheet allows you to change values directly, just as you would in an Excel spreadsheet. However, as you would expect from a React application, these changes are not reflected automatically in the other components. Why is that so?
After receiving the data from the Dashboard, a SpreadJS worksheet begins working with a copy, not the sales data declared in the Dashboard component. Events and functions should handle any data modification to update the app's state accordingly.
For the next task, you'll have to make the application reflect the changes made to the SpreadJS worksheet on all Dashboard components.
Step 3: Spreadsheet with Reactive Binding
Currently, the sales constant declared in the Dashboard.js file is responsible for maintaining the state of the application.
const sales = recentSales;
As we can see, this construction implies static data, preventing the dynamic updates we wish to implement. So, we'll replace that line of code with an assignment called a hook. In React, hooks have a simplified syntax that provides the declaration of the state value and the handler function simultaneously.
const[sales, setSales] = new useState(recentSales);
The code line above shows the JavaScript array destructuring syntax. The useState function is used to declare the sales constant, which holds the state data, and setSales, which references the function that changes the sales array in just one line.
However, this useState function does not exist in our application yet. We need to import it from the React package at the beginning of the Dashboard.js component file:
import React, { useState } from 'react';
Now, we are ready to update the state of the sales array when necessary.
We want to propagate changes made to the worksheet over the rest of the Dashboard. So, we have to subscribe to an event to detect the changes made to the Worksheet component cells and implement the corresponding event handling in the SalesTable.js file.
Let's call this event handler handleValueChanged.
<SpreadSheets hostClass={config.hostClass} valueChanged={handleValueChanged}>
We still need to implement a function with the same name. Inside it, we get the worksheet's data source array that was changed and pass this array to a function named valueChangeCallback.
    function handleValueChanged(e, obj) {
        valueChangedCallback(obj.sheet.getDataSource());
    }
    handleValueChanged.bind(this);
The valueChangedCallback function is then passed down from the Dashboard to the SalesTable component:
    <SalesTable tableData={salesTableData()}
        valueChangedCallback={handleValueChanged}/>
Now, you have to pass this callback function as a parameter for the SalesTable component:
export const SalesTable = ({ tableData, valueChangedCallback } ) => {
Any changes to a cell in the worksheet trigger the callback function, which executes the handleValueChanged_function in the Dashboard component. The _handleValueChanged function below must be created in the Dashboard component. It calls the setSales function, which updates the state of the component. As a result, the change propagates over the application's other components.
        function handleValueChanged(tableData) {
            setSales(tableData.slice(0));
        }
You can try this out by editing some of the values for the sales and seeing the sales numbers at the top of the dashboard change:

It looks like Bill made some great sales!
Step 4: Adding Excel Import/Export Features
So far, we've seen how to replace the static sales table with the SpreadJS spreadsheet. We also learned how to propagate the data update over application components through React's hooks and callbacks. And we managed to provide these features with very little code. Your application already looks awesome, and you feel confident it will impress your future client. But before that, let's put the icing on the cake.
You already know your corporate users often work with Excel in their day-to-day lives. The same users will start using your brand new app on top of React and SpreadJS. But at some point, they will miss the integration between Excel and your excellent dashboard.
The application would be much more powerful if you only could export spreadsheet data to Excel and import data from Excel into SpreadJS. How can you implement these features?
Let’s stop the app once again and install GrapeCity’s Spread.Sheets Client-Side Excel IO package, along with the file saver package:
    > npm install @grapecity/spread-excelio
    > npm install file-saver
    > npm start
To export data from our application to an Excel file (.xlsx extension), we have to modify the SalesTable component, declaring the import for the Excel IO and the file-saver components.
    import { IO } from "@grapecity/spread-excelio";
    import { saveAs } from 'file-saver';
Next, we'll change the JSX code of the SalesTable.js file to add a button to export the SpreadJS worksheet data to a local file. Clicking that button will trigger an event handler called exportSheet.
        .
        .
        .
        {/* EXPORT TO EXCEL */}
        <div className="dashboardRow">
            <button className="btn btn-primary dashboardButton"
              onClick={exportSheet}>Export to Excel</button>
        </div>
    </TablePanel>
The exportSheet function, in turn, will save the data from the worksheet to a file named SalesData.xslx. This function starts by serializing data from the Spread object into JSON format and then converting it into an Excel format through an Excel IO object.
    function exportSheet() {
        const spread = _spread;
        const fileName = "SalesData.xlsx";
        const sheet = spread.getSheet(0);
        const excelIO = new IO();
        const json = JSON.stringify(spread.toJSON({
            includeBindingSource: true,
            columnHeadersAsFrozenRows: true,
        }));
        excelIO.save(json, (blob) => {
            saveAs(blob, fileName);
        }, function (e) {
            alert(e);
        });
    }
Note how the above function requires a spread object, which must be the same instance as the SpreadJS worksheet we use in the SalesTable component. Once the SpreadSheet object is defined, the _getSheet(0)_call in the listing above retrieves the first worksheet in the spreadsheets array:
const sheet = spread.getSheet(0);
But how can we obtain the instance of the spreadsheet programmatically?
Once the spreadsheet object is initialized, the SpreadJS library triggers an event named workbookInitialized. We must handle it and store the instance as a state of the SalesTable component. Let’s first declare a state const for the spreadsheet instance with the useState hook:
const [_spread, setSpread] = useState({});
We need to import useState function into the React declaration at the beginning of the SalesTable.js component file:
import React, { useState } from 'react';
Now we can declare a function to handle the workbookInit event…
    function workbookInit(spread) {
        setSpread(spread)
    }
… and then bind the workbookInit event to the function we just created:
<SpreadSheets hostClass={config.hostClass} workbookInitialized={workbookInit} valueChanged={handleValueChanged}>
Now, the Export to Excel button will look like this:

Now let's demonstrate how to implement Excel data import. This process is the inverse of export, so let's start with the XLSX file.
The access point for this functionality is another button, which we need to add to the end of the SalesTable component's JSX code. Note that here we use a different button type: an input element of the "file" type, which produces a button that selects a file. When the file is selected, the onChange event fires the _fileChange_event handler:
    <div className="dashboardRow">
        {/* EXPORT TO EXCEL */}
        <button className="btn btn-primary dashboardButton"
          onClick={exportSheet}>Export to Excel</button>
        {/* IMPORT FROM EXCEL */}
        <div>
            <b>Import Excel File:</b>
            <div>
                <input type="file" className="fileSelect"
                  onChange={(e) => fileChange(e)} />
            </div>
        </div>
    </div>
The fileChange function, in turn, will use the Excel IO object to import the file into the sheet object. At the end of the function, a fileImportedCallback event is triggered to bring the data to the Dashboard component:
    function fileChange(e) {
        if (_spread) {
            const fileDom = e.target || e.srcElement;
            const excelIO = new IO();
            const spread = _spread;
            const deserializationOptions = {
                frozenRowsAsColumnHeaders: true
            };
            excelIO.open(fileDom.files[0], (data) => {
                const newSalesData = extractSheetData(data);
                fileImportedCallback(newSalesData);
            });
        }
    }
But this callback needs to be declared as a parameter of the SalesTable component:
    export const SalesTable = ({ tableData, valueChangedCallback,
        fileImportedCallback } ) => {
Also, we must provide the SalesTable component with the extractSheetData function by importing it from the util.js file:
import { extractSheetData } from "../util/util.js";
We need to implement the event handler for the saved file on the Dashboard component. The only thing this function does is update the state of the Dashboard with the data coming from the SpreadJS worksheet.
    function handleFileImported(newSales) {
        setSales(newSales.slice(0));
    }

    <SalesTable tableData={salesTableData()}
        valueChangedCallback={handleValueChanged}
        fileImportedCallback={handleFileImported}/>

In just a few simple steps, we've turned our boring app with static data into a reactive app centered around a spreadsheet with Excel import and export functionality. Finally, you review your client’s request and verify that your app satisfies all the requirements!
We could expand on these ideas and explore other exciting features for our application. For example, we can automatically and silently save our worksheet data, thus keeping a change log and rollback mistakes made to the table when needed.
Also, you could use SpreadJS events to synchronize the tabular data with a remote database. Or you could implement a Save button to replicate table data to an external system through web service methods.
If you have any questions or comments, leave them below.
Happy Coding!
An extensive list of the features of SpreadJS and live demos can be found here: https://www.grapecity.com/spreadjs/demos/


Top comments (0)