
Jamstack apps are easy to develop and have great performance, but there’s a catch — they’re largely pre-rendered and static. However, they don’t have to be! Static apps make sense for the fixed parts of your site, but Jamstack apps are capable of incorporating dynamic, interactive components as well.
In this hands-on tutorial, we’ll explore step-by-step how to add a SpreadJS spreadsheet to a Jamstack app created with Next.js. The Next.js React framework provides server-side pre-rendering out-of-the-box.
Getting Started
Before getting started, ensure you have Node.js installed together with npm. Otherwise, install them using one of these methods:
- Get the right installation binary for your operating system from the official website.
- Use the official package manager for your system.
- Use a Node version manager such as nvm.
Let’s get started by creating a Next.js app based on this template that incorporates Bootstrap 4 for CSS styles. To do this, head over to a new command-line interface (CLI) and run the following command:
npx create-next-app --example with-react-bootstrap nextspreadjsdemo
The npx utility executes Node packages. It comes bundled with npm from version 5.2 and up.
Thanks to npx, you don’t need to install create-next-app. However, if you prefer to install create-next-app on your system, run the following command instead:
npm install create-next-app --global
Next, go to your project’s folder and run the development server using the following commands:
    cd nextspreadjsdemo
    npm run dev
Then, navigate to http://localhost:3000/ with your web browser to see your application running. This is a screenshot of our application at this point:
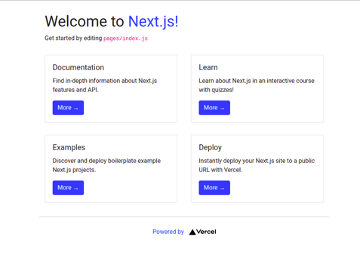
This is a minimally-styled user interface (UI) with Bootstrap cards. We can edit it from our project’s pages/index.js file.
Adding a Spreadsheet
Now that we have set up our Next.js application, let’s see step-by step how to set up SpreadJS in our Jamstack app.
Head over to a new command-line interface and run the following command from your project’s folder to install @grapecity/spread-sheets-react from npm. This package provides SpreadJS React wrapper components:
npm install @grapecity/spread-sheets-react
Next, create a components/SpreadSheet.jsx file inside your project using the following commands:
    mkdir components && cd components
    touch SpreadSheet.jsx
Once you have created the file, open the components/SpreadSheet.jsx file and add the following imports:
import React, { useState } from "react";
import { SpreadSheets, Worksheet, Column } from "@grapecity/spread-sheets-react";
import * as GC from "@grapecity/spread-sheets";
Then, add the following line to set up an evaluation license:
GC.Spread.Sheets.LicenseKey = window["evalKey_V14"];
Next, define the following function:
export default function SpreadSheet() {

const [spreadBackColor, setSpreadBackColor] = useState('aliceblue');
const [sheetName, setSheetName] = useState('Empolyees');
const [hostStyle, setHostStyle] = useState({
width: '100%',
height: '700px'
});
const dataArr = [
{
"jobTitleName":"Developer",
"preferredFullName":"Romin Irani",
"region":"CA",
"phoneNumber":"408-1234567"
},
{
"jobTitleName":"Developer",
"preferredFullName":"Neil Irani",
"region":"CA",
"phoneNumber":"408-1111111"
},
{
"jobTitleName":"Program Directory",
"preferredFullName":"Tom Hanks",
"region":"CA",
"phoneNumber":"408-2222222"
}
];
const [data, setData] = useState(dataArr);
const [columnWidth, setColumnWidth] = useState(200);
return (
<SpreadSheets backColor={spreadBackColor} hostStyle={hostStyle}>
<Worksheet name={sheetName} dataSource={data}>
<Column dataField='preferredFullName' width={columnWidth}></Column>
<Column dataField='jobTitleName' width={columnWidth}></Column>
<Column dataField='phoneNumber' width={columnWidth}></Column>
<Column dataField='region' width={columnWidth}></Column>
</Worksheet>
</SpreadSheets>);
}
We use the useState hook to define some state variables to hold the spreadsheet name, color, column width, style, and data. Then, we create our spreadsheet using SpreadSheets, Worksheet, and Column React components. This is one way of creating spreadsheets with SpreadJS and React. In the next section, we’ll explore a second way, using JavaScript methods.
Next, open the pages/index.jsx file and update it as follows:
import { Container, Row, Col } from 'react-bootstrap';
import dynamic from "next/dynamic";
const SpreadSheet = dynamic(
() => {
return import("../components/SpreadSheet");
},
{ ssr: false }
);

export default function Home() {

return (
<Container>
<h1>
Adding Spreadsheets to a Jamstack Application
</h1>
<p>
Next.JS + SpreadJS demo
</p>
<Container>
<Row className="justify-content-md-between">
<Col>
<SpreadSheet />
</Col>
</Row>
</Container>
</Container>
)
}
Now, open the style/index.css file and add the following line:
@import "@grapecity/spread-sheets/styles/gc.spread.sheets.excel2013white.css";
This imports SpreadJS CSS into our application.
Note that if you import the component as follows:
import SpreadSheet from "../components/SpreadSheet";
You get the error: ReferenceError: document is not defined.
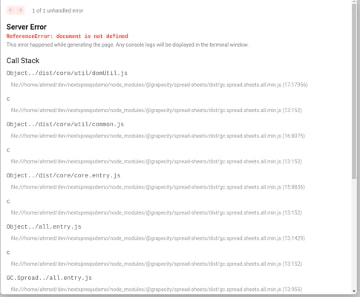
This is because SpreadJS replies on the document object, which is available only on browsers. In Node.js, document is not defined. To avoid this error, we need to tell Nest.js to render this component on the client and not on the server, using:
const SpreadSheet = dynamic(
() => {
return import("../components/SpreadSheet");
},
{ ssr: false }
);
There are many ways to render a client-side-only component in Next.js. In our example, we import our SpreadSheet component using dynamic imports and set srr: false so our component will not render on the server-side.
Loading Data from a JSON File
Now that we have seen how to display a spreadsheet with data loaded from a JavaScript array, let’s see how to load data from a JSON file. Go back to the components/SpreadSheet.jsx file and update it as follows:
const [data, setData] = useState([]);
const [columnWidth, setColumnWidth] = useState(200);

useEffect(()=>{
async function getData(){
const res = await fetch("data.json");
const data = await res.json();
setData(data.employees);

console.log(data);
}

getData();
},[]);
We first define two state variables, data and columnWidth, using the useState hook.
Next, inside the useEffect hook, we use the JavaScript fetch method with Async/Await to get the JSON data file. Then, we assign the fetched data to our data state variable.
Next, inside the public/ folder, create a data.json file and add the following data:
{
"employees": [
{
"jobTitleName": "Developer",
"preferredFullName": "Romin Irani",
"region": "CA",
"phoneNumber": "408-1234567"
},
{
"jobTitleName": "Developer",
"preferredFullName": "Neil Irani",
"region": "CA",
"phoneNumber": "408-1111111"
},
{
"jobTitleName": "Program Directory",
"preferredFullName": "Tom Hanks",
"region": "CA",
"phoneNumber": "408-2222222"
}
]
}
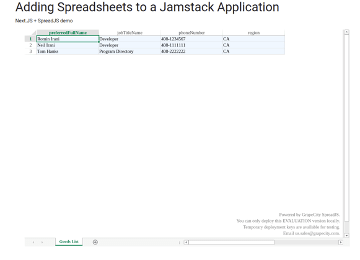
At this point, your app should look like this:
Adding Charts
Now, let’s add charts and visualizations to our application. Similar to Excel, SpreadJS supports creating and displaying charts using spreadsheet data. You can render different types of two-dimensional charts and customize their elements to enable users to visualize data efficiently.
You can use charts to analyze trends and patterns in data sets. Let’s suppose we have sales data for the past four years. Using charts, we can easily see which year had the most sales.
Thanks to the chart function in SpreadJS, you can visualize data in your applications while keeping all the chart elements in synchronization with React’s native data binding support. Before using charts in our spreadsheet, we first need to extend SpreadJS with chart support using the @grapecity/spread-sheets-charts package.
Head over to your command-line interface and run the following command from your project’s root folder:
npm install @grapecity/spread-sheets-charts
Now, go back to the components/SpreadSheet.jsx file and import the package as follows:
import '@grapecity/spread-sheets-charts';
Then, add a second worksheet to display the chart and set the workbookInitialized event as follows:
<SpreadSheets backColor={spreadBackColor} hostStyle={hostStyle} workbookInitialized={workbookInit}>
...
<Worksheet name= "Chart">
</Worksheet>
</SpreadSheets>
Next, add the following code to the SpreadSheet component:
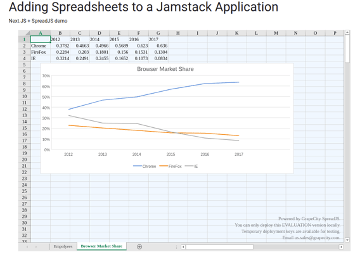
let dataArray = [
["", '2012', '2013', '2014', '2015', '2016', '2017'],
["Chrome", 0.3782, 0.4663, 0.4966, 0.5689, 0.6230, 0.6360],
["FireFox", 0.2284, 0.2030, 0.1801, 0.1560, 0.1531, 0.1304],
["IE", 0.3214, 0.2491, 0.2455, 0.1652, 0.1073, 0.0834],
];

const workbookInit = (spread) => {

let chartSheet = spread.getSheet(1);
chartSheet.setArray(0, 0, dataArray);

chartSheet.suspendPaint();
let chart = chartSheet.charts.add(('Chart1'), GC.Spread.Sheets.Charts.ChartType.line, 30, 85, 800, 350, "A1:H4", GC.Spread.Sheets.Charts.RowCol.rows);
spread.resumePaint();
};
The workbookInitialized event fires after the spread initialization. We can access the initialized spreadsheet object in the assigned event callback.
First, define a data array containing browser use for six years. Then, define a workbookInit function.
We bind the workbookInit function to the workbookInitialized event to reference the spreadsheet. Then, we access the sheet where we want to display the chart using the getSheet method. We use the sheet’s setArray method to set the browser use data and the charts.add method to display a line chart of the data array. The result looks like this:
Conclusion
Throughout this article, we learned how to quickly and easily add spreadsheets to a Next.js Jamstack app using SpreadJS. You can get the project’s complete code from this GitHub repository.
Now that you know how to add spreadsheets to your Jamstack apps, there’s so much you can do! You can use spreadsheets and charts to help your customers understand their monthly account usage, help your users visualize real estate sales in their neighborhood, or even help your managers see how much time you saved plugging SpreadJS into your application.


Top comments (0)