Having a way to monitor and measure application performance is essential to building high-quality, reliable software. To continuously improve performance and usability for users it is paramount to have some insight into the state of the application at all times.
Application Insights is an application performance management service for software applications that enables you to monitor your application performance in Azure. With it, you can detect and diagnose application issues, track performance and gain insight into what users do with your application.
How Does It Work?
Without going too much into the specifics.
- You install the Application Insights SDK in your project.
- The SDK collects data from your project
- It then transfers these data to your custom Application Insights portal on Azure for better analysis.
In this article, I am going to be walking through the process of setting up application insight for a demo Asp.NetCore MVC application.
PREREQUISITES
- VS CODE vscode
- An Azure account. You can create it for free here. Ps you get 200dollars free Azure credits and 12month's pay as you go.
CREATING THE PROJECT
- Create a new asp.net core MVC project.
$ dotnet new mvc -n ApplicationInsightsDemo
Enable Application Insights server-side
- Log on to Azure Portal
- Create a resource -> search for -> Application Insights
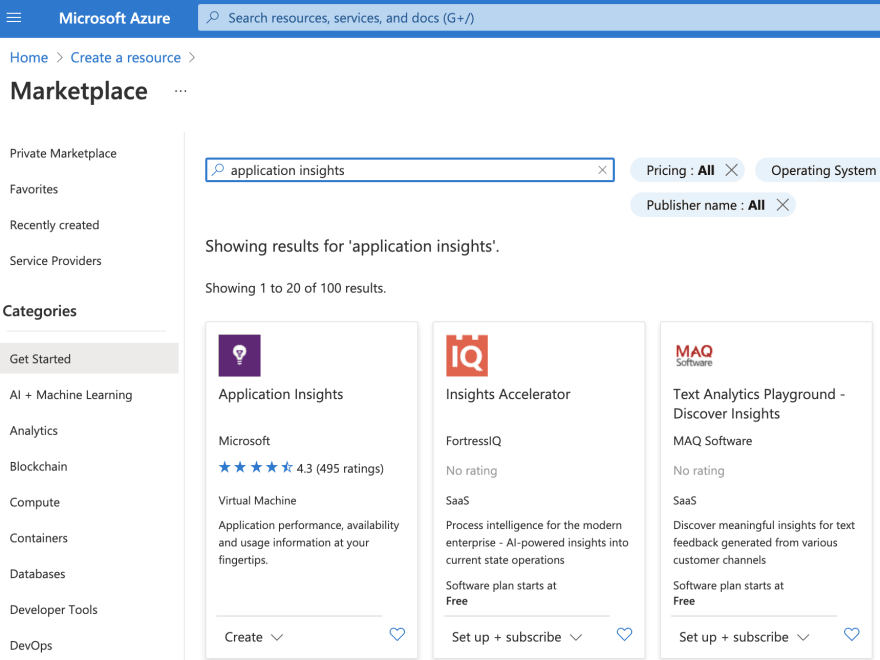
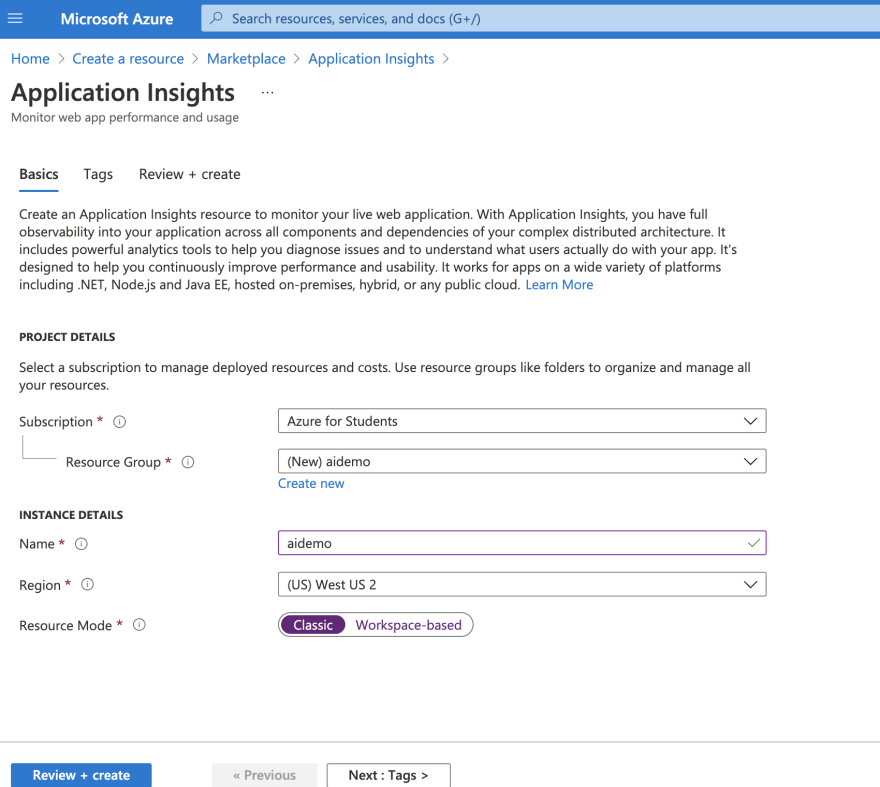
- Fill in the required details.
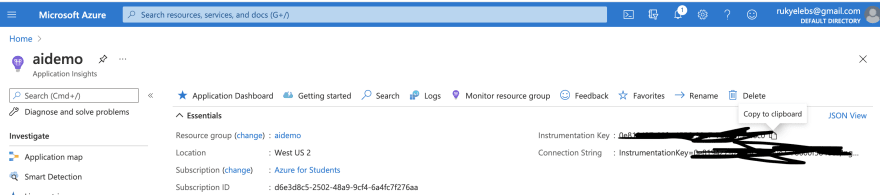
- Browse to the resource and copy your instrumentation key.
- Add the Application Insights.NetCore SDK package to your application.
$ dotnet add package Microsoft.ApplicationInsights.AspNetCore
- In the startupClass inside the ConfigureServices() method Add services.AddApplicationInsightsTelemetry().
      public void ConfigureServices(IServiceCollection
                                    services)
        {
            services.AddApplicationInsightsTelemetry();
            services.AddControllersWithViews();
        }
- Specify the instrumentation key in appsettings.json as shown below. This key points to your specific app insight instance on azure.
{
  "ApplicationInsights": {
    "InstrumentationKey": "yourinstrumentationkeyhere"
  },
  "Logging": {
    "LogLevel": {
      "Default": "Information",
      "Microsoft": "Warning",
      "Microsoft.Hosting.Lifetime": "Information"
    }
  },
  "AllowedHosts": "*"
}
Enabling Application Insights client-side
We need to enable telemetry information for the client-side of the application to help us collect information from the client.
- In _ViewImports.cshtml, add an injection
$ @inject Microsoft.ApplicationInsights.AspNetCore.JavaScriptSnippet JavaScriptSnippet
This _ViewImports.cshtml page in ASP.NET is the base page for all the rest of the pages for the application, so adding this code here will add the code in the rest of the pages of the application at runtime.
- In _Layout.cshtml, insert HtmlHelper at the end of the section but before any other script.
$ @Html.Raw(JavaScriptSnippet.FullScript)

Now that we have set it up application insights in our application. Let's make some tweaks to the application to really see what application insights can help us with.
I have modified my MVC app to add 3 things
- A call to a database service to load users.
- A call to an external API resource
I also added buttons on the client to help interact with these different services. As we interact with the different services, we can see how application insights can help monitor our application's state.
The full source code is here.
- Run the application and refresh it a couple of times.
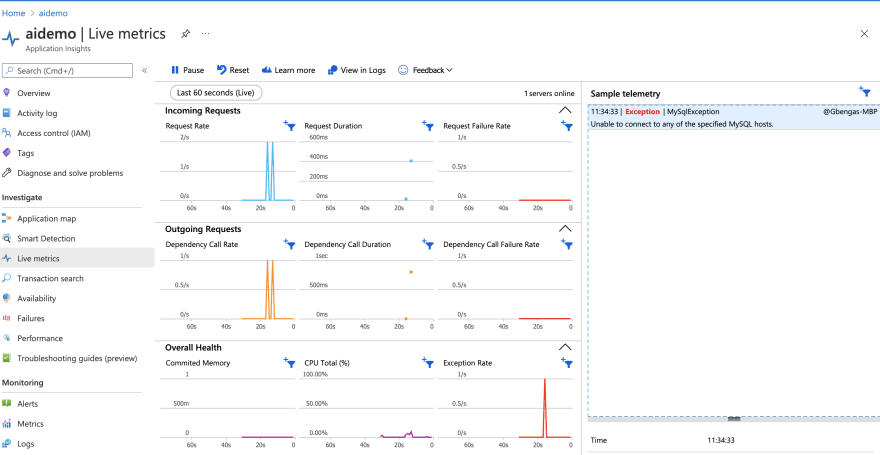
Now go to your app insights instance on the Azure portal.
Click on Live Metrics. You should see data from your application being displayed on the dashboard.
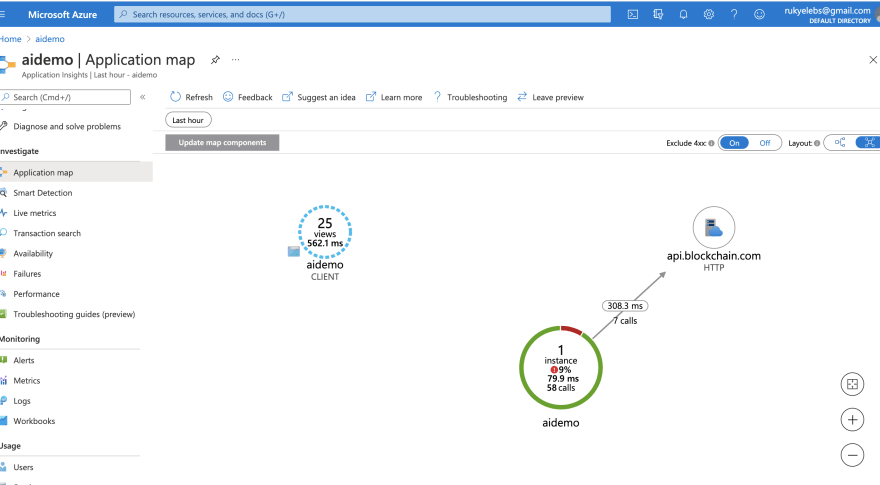
- On the Application Insights portal navigate to the performance. You can drill into the operations to get a better insight.

- AI automatically tracks dependencies such as HTTP/HTTPS Calls, Calls made with SqlClient. You can see the full list here.
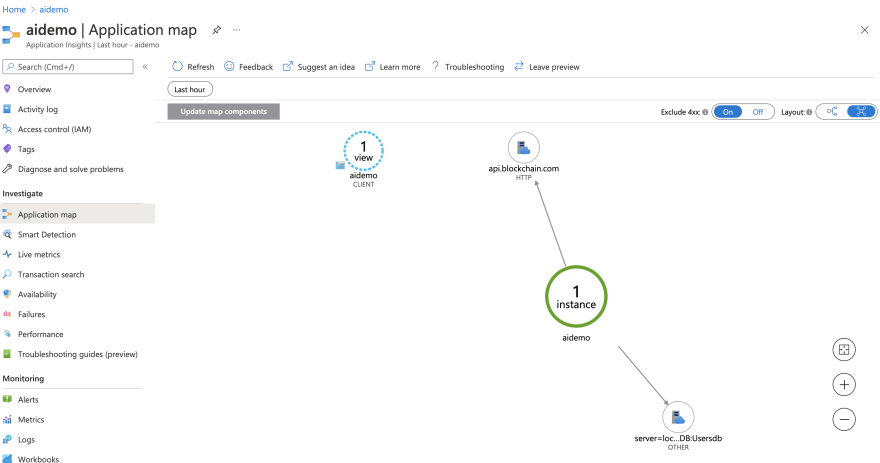
 In my case, I am using a MySQL DB which AI does not track automatically. You can configure it for AI tracking by adding your own custom dependency tracking.
Adding Custom Dependency Tracking
- Inject a telemetry client instance in the constructor of the class you want to use it in.
private TelemetryClient _telemetryClient;
- Wrap your call to the MYSQL db like this.
using (var operation = _telemetryClient.StartOperation<DependencyTelemetry>("MySqlDb"))
                {
                    string query = @"SELECT UserName FROM Users";
                    operation.Telemetry.Data = query;
                    operation.Telemetry.Target = $"server={host}:{port} - DB:{usersDataBase}";
                    //sending details of the database call Application insights
                    using (var connection = new MySqlConnection(connString))
                    {
                        result = await connection.QueryFirstOrDefaultAsync<string>(query, CommandType.Text);
                    }
                    if (!string.IsNullOrEmpty(result))
                    {
                        operation.Telemetry.Success = true;
                        //informing Application Insights that the db call is successful
                    }
                    _telemetryClient.StopOperation(operation);
                }
See this article for more details on tracking custom dependencies trackdependency.
Testing the Application
- Click on Call Database

- Navigate to application insights ->Live Metrics-> check for the details.
- You can see all application dependencies by going to the dependencies tab.
Note: There is a lag of about 5mins when viewing logs on other tabs. Only Live metrics provide the logs in real-time. So you will have to wait for about 5mins to analyze the logs.
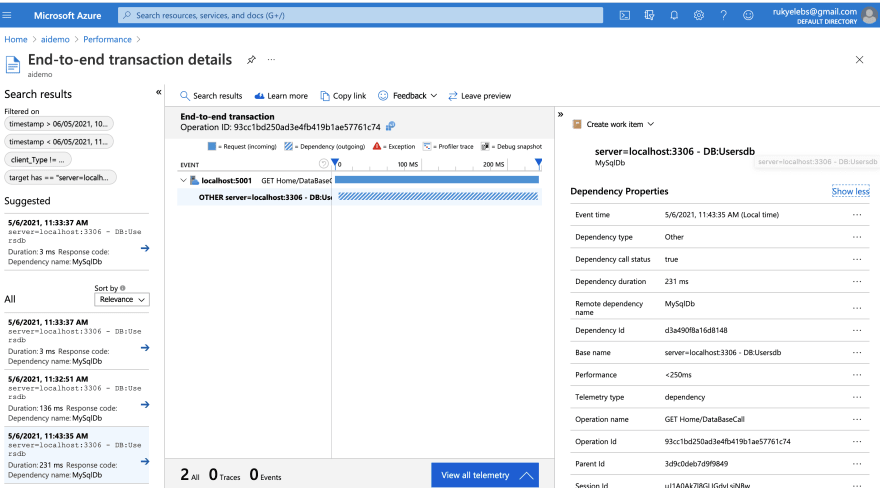
 See our custom dependency
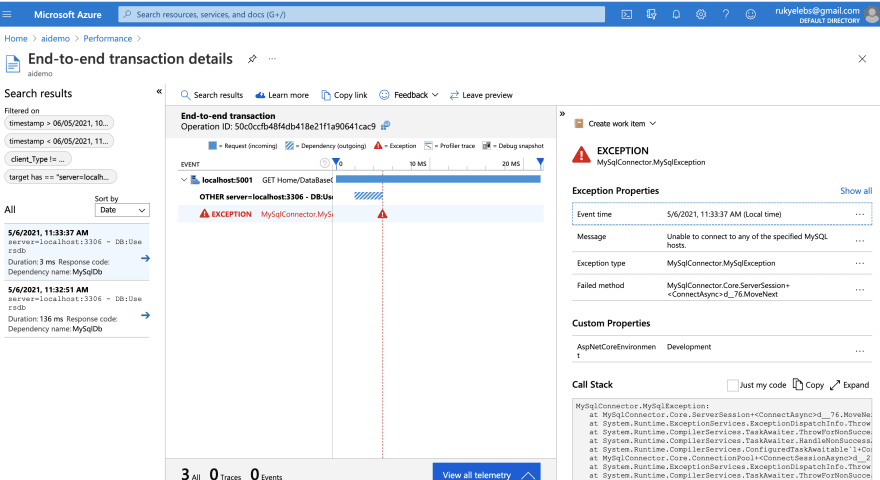
 - Click on view details -> investigate performance-> Drill Into and check for the details

- We can see that application insight identifies the database service the operation was carried out on, with the exact SQL queries and the request and response times.
Exception when DB was not started
 .
.
When DB is up and running
- You could even see what happened before this exception occurred by clicking on User flows.
The User Flows tool starts from an initial page view, custom event, or exception that you specify. Given this initial event, User Flows shows the events that happened before and afterward during user sessions.

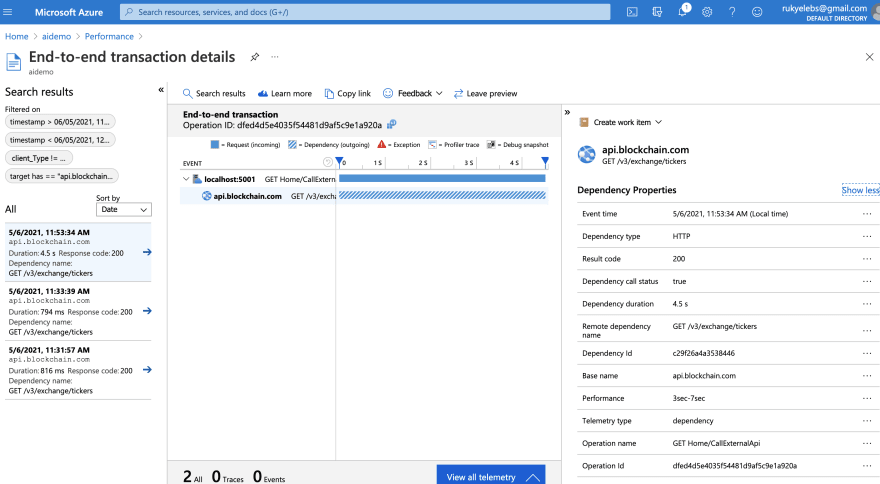
- Let's test an external API call.
You can see the request and response times as well as the URL being called.
For client-side statistics, Go to -> Users.Check the number of users that have visited your site and the time. You could even filter by events or for properties like country name, browser version, device type.

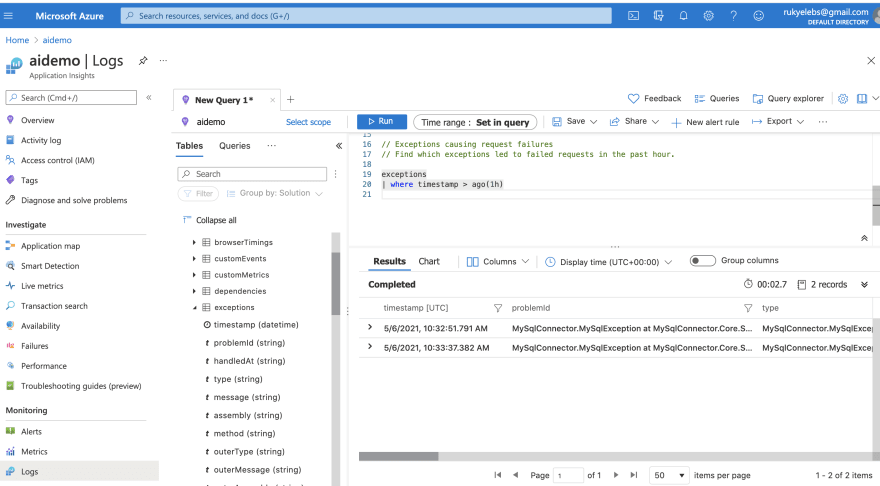
Log Analytics.
All the data for application insights is pushed to a place called Log analytics you can go there and query the logs directly using the Kusto language query syntax. You can access it by Clicking on ->Logs from the side menu. On the left-hand side of the log analytics monitor under tables, you will see the telemetry data which is being queried.
Example
Let's query the number of exceptions that occurred in the last hour.
exceptions
| where timestamp > ago(1h)
You could create alert rules for your logs. By clicking on New Alert Rule So it alerts you when a certain event happens. In my case, I created an alert rule for when there are more than 9 exceptions in 5 minutes.

Play around with your own custom tweaks. Monitor, Measure and Optimize!
RESOURCES


Oldest comments (0)