In this article I just summarize shortly how you can apply what I've already written to profiler:

Code example
I just copied the code from the last article. Our goal is to set a breakpoint in ProfilerCallback::ExceptionThrown in line 33. then we can inspect the parameter objectID. I will do this very quickly. If you want more information, go to the blog post I mentioned.
Howto
- Add a
Console.Read();at the very beginning of the .NET test application. This gives us time to attach a debugger - Start app by executing
start.bat - Start WinDbg & attach to process of
TestApp - set breakpoint:
bp DevToNetProfiler!ProfilerCallback::ExceptionThrown - enter
g + enterto continue - enter any key in your
TestApp - your breakpoint should be hit and you should see the source code:
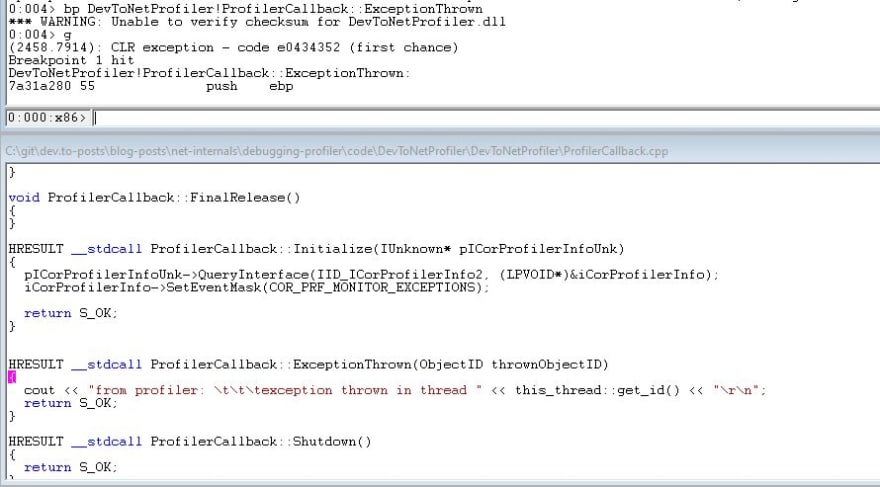
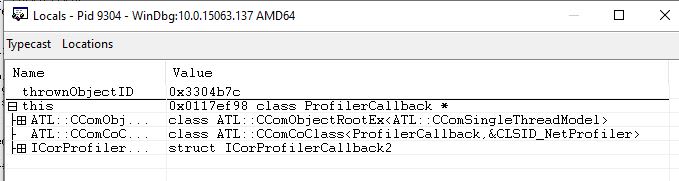
- go to
View > Localsto list all local variables, including parameters:
How to debug Initialize()?
Let's say you want to debug the Initialize() method. The steps above won't work because if you attach to the running process, the Initialize() has already finished. But don't worry, this can be done with a few extra steps.
Adjust the start.bat
The key here is to expose the environment variables in the context where the TestApp is running. To do this you don't need to start the app directly from the batch file. So open start.bat and replace:
START TestApp/bin/Debug/TestApp.exe
with the path where the WinDbg.exe is on your PC:
START C:\Tools\WinDbg\windbg.exe
Start WinDbg
Execute the batch file. WinDbg should now appear.
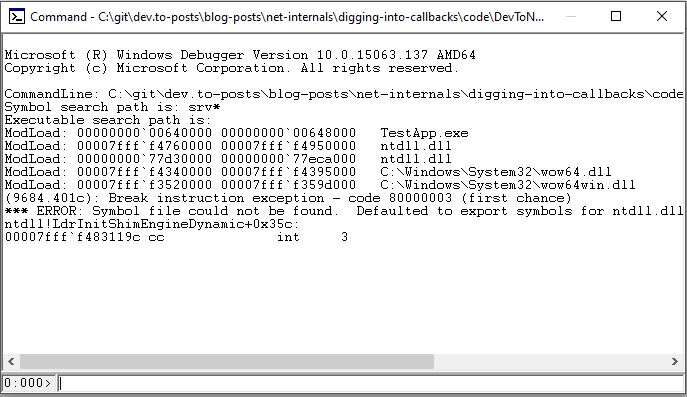
Execute TestApp.exe
Go to File > Open Executable... and select TestApp.exe. WinDbg should immediately stop the execution:
Set a breakpoint
Do you remember the defered breakpoints I mentioned in my WinDbg blog post? As WinDbg stopped directly after TestApp was executed, nothing was loaded yet. So every breakpoint will be a defered one.
Enter the breakpoint:
bp DevToNetProfiler!ProfilerCallback::Initialize
And you should see this message:

Continue
Enter g + enter to continue the execution. In my setup, WinDbg stops again with this message:

We don't care about that message so let the app continue again. Now the breakpoint is hit:

Found a typo?
As I am not a native English speaker, it is very likely that you will find an error. In this case, feel free to create a pull request here: https://github.com/gabbersepp/dev.to-posts . Also please open a PR for all other kind of errors.
Do not worry about merge conflicts. I will resolve them on my own.


Oldest comments (0)