Here is a simple use case: payement operations with a daily limit. A customer can execute multiple operations at the same time, and the limit cannot be lower than zero. You need to be sure that when you read the current limit, no other operation can happen until you commit yours.
TL;DR: there are two ways to speed it up: use optimal SQL or run on YugabyteDB 🚀
I will run this on Amazon Aurora with PostgreSQL compatibility, as an example of the best High Availability for a monolithic database (storage is multi-AZ), and on YugabyteDB which is distributed, scaling out reads and writes with the highest Availability, also in a multi-AZ deployement.
I create the following table to store a daily limit per customer per day:
drop table if exists daily_limit;
create table daily_limit (
 customer_id bigint,
 day date,
 daily_limit bigint check (daily_limit>0),
 primary key (customer_id, day),
 last_update timestamp default now()
) --split into 10 tablets
;
I insert 4 customers and 1000 days (but will query only one day):
insert into daily_limit (customer_id, day, daily_limit)
select customer_id, day, 1e9 from
( select date '2022-01-01' + generate_series(1,1000) as day) days,
(select generate_series(1,4)  as customer_id) customers
;
My pgbench custom script is subtracting a random amount on a random customer, and reads the limit to check it (but anyway, the check constraint takes care of it):
\set customer random(1,4)
\set amount   random(1,10)
begin transaction;
select daily_limit from daily_limit
 where customer_id=:customer and day=now()::date for update
\gset
\set daily_limit :daily_limit - :amount
update daily_limit
 set daily_limit=:daily_limit, last_update=now()
 where customer_id=:customer and day=now()::date;
commit;
I run it with pgbench:
pgbench -nf /tmp/daily_limit_pgbench.sql -M extended -T 900 -c 100
This runs 100 threads on 4 customers, to stress the hotspot scenario. The RAM and I/O doesn't really matter for this as we will see by looking at the resource usage.
Aurora db.r6g.2xlarge
I'm running the pgbench above on an Aurora db.r6g.2xlarge (8 vCPU - Graviton 2) instance. First with the exact script above
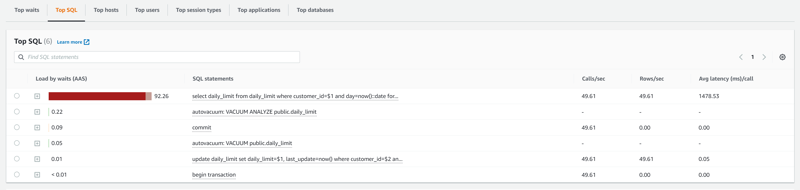
SELECT ... FOR UPDATE
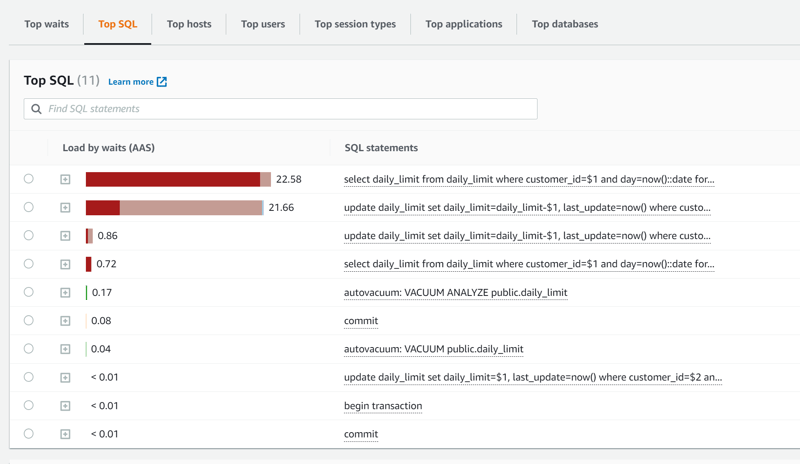
During the execution, I can see that the bottleneck is waiting on row lock Tuple:lock for the select for update, which is not surprising at all. Once the row lock is acquired, the update is fast.
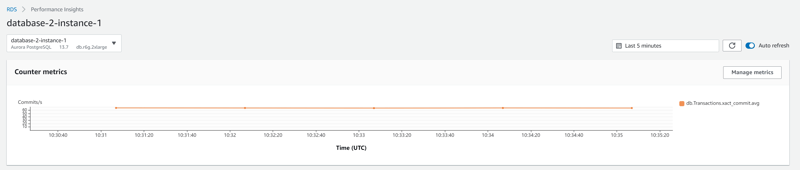
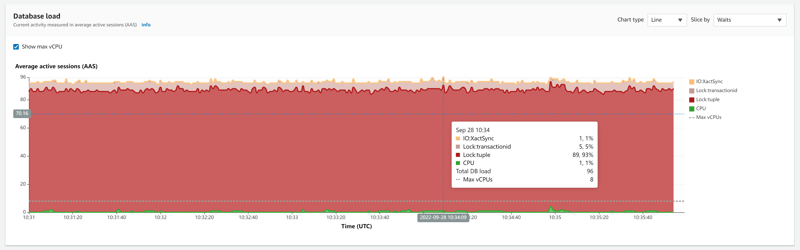
This is not surprising as it is not scalable by design, with 100 sessions reading the same 4 rows.
Here is the pgbench result:
pgbench (15devel, server 13.7)
transaction type: /tmp/daily_limit_pgbench.sql
scaling factor: 1
query mode: extended
number of clients: 100
number of threads: 1
duration: 900 s
number of transactions actually processed: 54401
latency average = 1623.978 ms
initial connection time = 20440.648 ms
tps = 61.577197 (without initial connection time)
This is 60 transactions per seconds at more than 1 second average latency. Now, let's do better.
UPDATE ... RETURNING
Instead of reading the value, and updating it, I update it and read the value:
\set customer random(1,4)
\set amount   random(1,10)
begin transaction;
update daily_limit set daily_limit=daily_limit-:amount, last_update=now() where customer_id=:customer and day=now()::date returning daily_limit-:amount as daily_limit
\gset
commit;
This is functionally equivallent. The \gset gets the same value for :daily_limit here as it did before.
Now, instead of waiting to acquire the lock on the row (lock:tuple in dark red), we wait on the other transaction (lock:transactionid in light red), but with a higher thoughput:
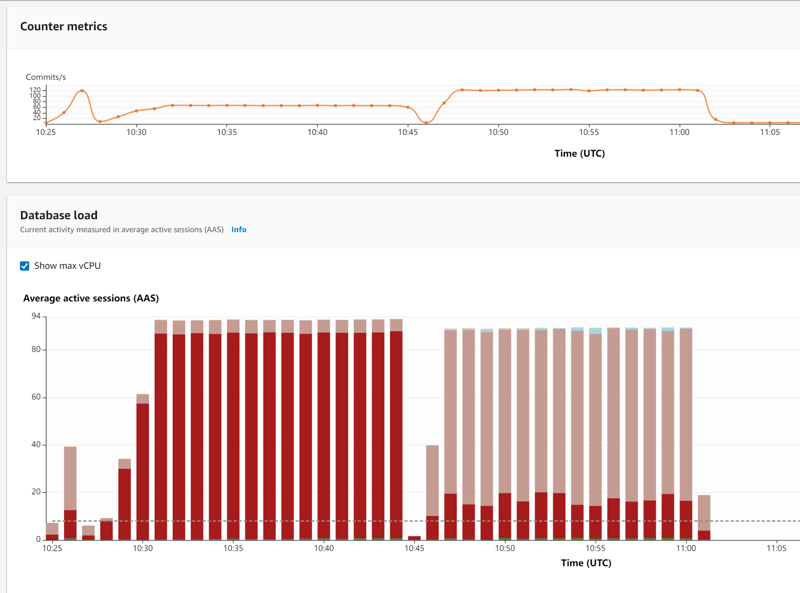
The pgbench result is:
pgbench (15devel, server 13.7)
transaction type: /tmp/daily_limit_pgbench.sql
scaling factor: 1
query mode: extended
number of clients: 100
number of threads: 1
duration: 900 s
number of transactions actually processed: 103483
latency average = 851.452 ms
initial connection time = 20581.529 ms
tps = 117.446446 (without initial connection time)
The thoughput has increased by two here, and the latency decreased by two, which is a clear benefit.
SELECT FOR SHARE
I tried a select ... for share to see if the first solution was better without taking immediately the exclusive lock. But it failed with deadlock:
pgbench (15devel, server 13.7)
pgbench: error: client 43 script 0 aborted in command 5 query 0: ERROR:  deadlock detected
DETAIL:  Process 4208 waits for ShareLock on transaction 181709; blocked by process 4173.
Process 4173 waits for ShareLock on transaction 181707; blocked by process 4208.
HINT:  See server log for query details.
CONTEXT:  while updating tuple (7,128) in relation "daily_limit"
I didn't look into the details. If you think that can avoid deadlocks by ordering the DML statements in the transaction, then you have a proof that it is not sufficient as all transactions are the same here.
Yugabyte 3x c5.4xlarge
Let's now run on YugabyteDB, PostgreSQL compatible distributed SQL database.
SELECT ... FOR UPDATE
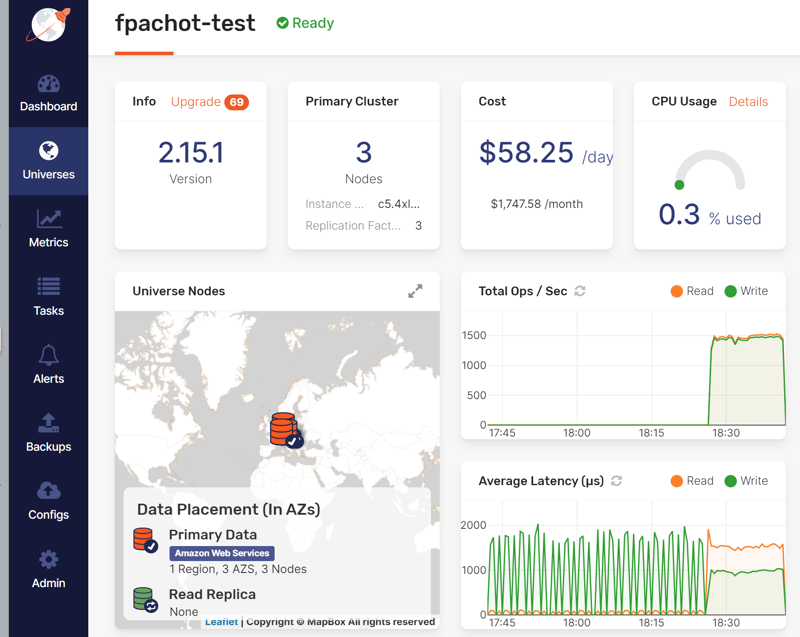
I've done the same as above on a YugabyteDB cluster. I have 3 nodes here with c5.4xlarge just because this is my default cluster, but this doesn't really matter here. The resource consumption is very low. I wanted to be sure that the throughput can scale and I've split the table to 10 tablets to be sure that my 4 rows are on different nodes.
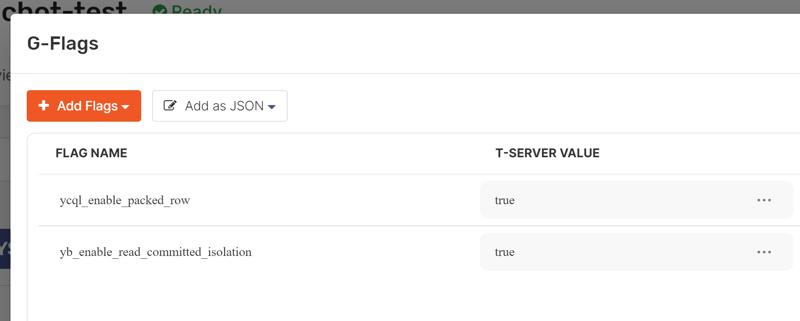
YugabyteDB, in this version, uses optimistic locking (with exponential retries rather than wait list) but offers the same Read Committed semantic as PostgreSQL because I've set yb_enable_read_committed_isolation:
I'm running in version YugabyteDB 2.15.1
SELECT ... FOR UPDATE
pgbench (15devel, server 11.2-YB-2.15.1.0-b0)
transaction type: /tmp/daily_limit_pgbench.sql
scaling factor: 1
query mode: extended
number of clients: 100
number of threads: 1
duration: 900 s
number of transactions actually processed: 115433
latency average = 777.159 ms
initial connection time = 6679.005 ms
tps = 128.673725 (without initial connection time)
This, even with select ... for update is better than the best Aurora result above with the optimized code.
UPDATE ... RETURNING
Now running the optimized code.
pgbench (15devel, server 11.2-YB-2.15.1.0-b0)
transaction type: /tmp/daily_limit_pgbench.sql
scaling factor: 1
query mode: extended
number of clients: 100
number of threads: 1
duration: 900 s
number of transactions actually processed: 191716
latency average = 467.408 ms
initial connection time = 6644.640 ms
tps = 213.945698 (without initial connection time)
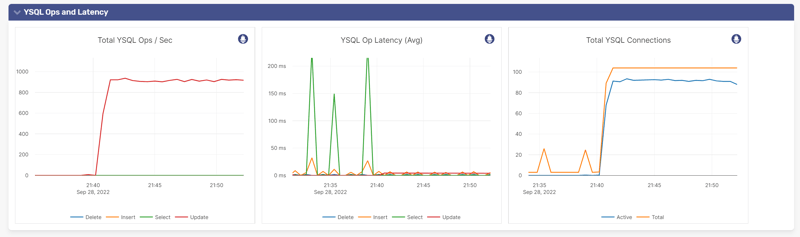
With the update ... returning I have more than 200 transactions per seconds with a 500 millisecond latency.
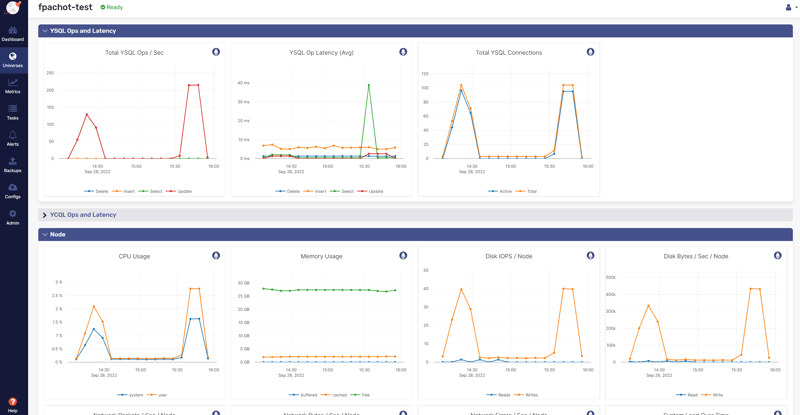
Looking at the resource usage, it is obvious that the number of CPU, RAM or I/O doesn't matter. This is all about the lock management:
Other observations and remarks
My Aurora instance above was with Graviton 2
db.r6g.2xlarge(Arm processor). By curiosity I've run the same with adb.r6i.2xlargeIntel and got the same (60 tx/s at 1700ms latency for the first test, and 115tx/s at 800ms for the second one). Graviton 2, for this, is cheaper but not faster.pgbenchruns on PostgreSQL compatible databases. It would be interesting to do the same on Oracle Database, with and without Data Guard protection, and with and without RAC load balancing. When it comes to hotspots, locks and transactions, you cannot compare databases with different level of protection and scalability. To get a level of HA comparable to YugabyteDB you need RAC and Data Guard in maximum protection mode. This adds latency on the current block shipping, the distributed lock and on transaction commits.In
pgbenchif an error occurs, the client ends. When expecting serialization errors, you can use the Yugabyte version of itysql_benchwhich handles retries.With YugabyteDB optimistic locking, there are parameters to control the optimistic locking retries. This can be set in the transaction:
set local retry_backoff_multiplier=2;
set local retry_max_backoff='1s';
set local retry_min_backoff='100ms';
Those values are the default ones (choose a retry delay between 100 and 1000 millisecond, and multiply by two for each retry). You can get higher throughput by tuning that, but this depends on your application behavior.
For the test above with update ... returning I get the following:
pgbench (15devel, server 11.2-YB-2.15.1.0-b0)
transaction type: /tmp/daily_limit_pgbench.sql
scaling factor: 1
query mode: extended
number of clients: 100
number of threads: 1
duration: 60 s
number of transactions actually processed: 14542
latency average = 372.433 ms
initial connection time = 6655.605 ms
tps = 268.504754 (without initial connection time)
with this:
\set customer random(1,4)
\set amount   random(1,10)
begin transaction;
set local retry_backoff_multiplier=2;   -- default 2
set local retry_max_backoff='100ms';    -- default 1s
set local retry_min_backoff='10ms';     -- default 100ms
update daily_limit set daily_limit=daily_limit-:amount, last_update=now() where customer_id=:customer and day=now()::date returning daily_limit-:amount as daily_limit
\gset
commit;
This is more than 250 transactions per second with less than 400 milliseconds latency from 100 threads updating the same 4 rows.
- You can do better with a stored procedure. If I create:
create or replace procedure run(c bigint, a int) as $$
 update daily_limit
 set daily_limit=daily_limit-a, last_update=now()
 where customer_id=c and day=now()::date
 returning daily_limit-a as daily_limit
$$ language sql;
the script is reduced to:
\set customer random(1,4)
\set amount   random(1,10)
call run(:customer,:amount);
and I run it with the simple protocol:
pgbench -nf /tmp/daily_limit_pgbench.sql -T 900 -c 100
and I get:
pgbench (15devel, server 11.2-YB-2.15.3.0-b0)
transaction type: /tmp/daily_limit_pgbench.sql
scaling factor: 1
query mode: simple
number of clients: 100
number of threads: 1
duration: 900 s
number of transactions actually processed: 486787
latency average = 183.903 ms
initial connection time = 6234.570 ms
tps = 543.766181 (without initial connection time)
500 transaction per second with less than 200 milliseconds latency.
- Final note: this is about speedup, not scalability. This application is not scalable by design. There are ways to improve like I did for the default
pgbenchworkload in a previous post Avoiding hotspots in pgbench on 🐘or🚀. But measuring that the speed of lock acquisition is similar, and even better, in a distributed architecture like YugabyteDB is a great result.


Oldest comments (0)