Here is my quick test on YugabyteDB after reading the "Huge List of Database Benchmark" comparing some distributed databases. The idea of the article is awesome: take all distributed databases, or similar, and see how they behave when node fails. I'll lok first at what is run on a single node and will probably write another post about HA.
Install lab
I've installed an Oracle Linux 7.9 VM on the Oracle Cloud (VM.Standard.E2.8 with 8 cores - 16 vCPUs). I'm not a specialist of Go, so maybe I didn't do it in the right way with the packages, but it works (comments are welcome😉).
Docker
I've installed Docker and docker-compose:
# Docker
sudo yum update -y
sudo yum install -y git docker postgresql
sudo systemctl enable --now docker
# Docker compose
sudo curl -o /var/tmp/docker-compose -L -s https://github.com/docker/compose/releases/download/v2.1.1/docker-compose-linux-x86_64 ; sudo chmod a+x /var/tmp/docker-compose
Get the project
The project with the docker-compose.yaml and a Go program is on GitHub:
# get the hugedbbench project
git clone https://github.com/kokizzu/hugedbbench.git
Start YugabyteDB (1 node)
I disable SELinux to avoid a permission error, remove previous runs and start the single-node setup. I'll look at the performance and I prefer to start with one node here.
sudo setenforce 0
sudo /var/tmp/docker-compose -f hugedbbench/2021/yugabytedb/docker-compose-single.yaml down
sudo rm -rf /home/opc/hugedbbench/2021/yugabytedb/{ybmaster1,ybtserver1}
mkdir -p /home/opc/hugedbbench/2021/yugabytedb/{ybmaster1,ybtserver1}
sudo /var/tmp/docker-compose -f hugedbbench/2021/yugabytedb/docker-compose-single.yaml up &
Get Go and the required packages
I've gathered them one by one and got many problems with earlier versions of go:
# Go 1.17
curl -sL https://golang.org/dl/go1.17.3.linux-amd64.tar.gz | tar -C /var/tmp -zx ; alias go=/var/tmp/go/bin/go
# packages for the project
go mod init hugedbbench/2021/yugabytedb/main_test.go
go get github.com/jackc/pgx/v4/pgxpool github.com/kokizzu/gotro/I github.com/kokizzu/gotro/L@v1.1018.858 github.com/kokizzu/id64 github.com/stretchr/testify
Run
I'm ready to run the test:
go test -v hugedbbench/2021/yugabytedb/main_test.go
Here is my first result:
-sh-4.2$ go test -v hugedbbench/2021/yugabytedb/main_test.go
=== RUN   TestDb
=== RUN   TestDb/insert
YugaByteDB InsertOne 45.177450191s
YugaByteDB Count 318.284925ms
=== RUN   TestDb/update
YugaByteDB UpdateOne 58.050495088s
YugaByteDB Count 314.846889ms
=== RUN   TestDb/select
YugaByteDB SelectOne 9.396298099s
YugaByteDB Total 1m53.295226811s
--- PASS: TestDb (113.30s)
    --- PASS: TestDb/insert (44.15s)
    --- PASS: TestDb/update (58.05s)
    --- PASS: TestDb/select (9.40s)
PASS
ok      command-line-arguments  113.300s
This is not exactly the same result as the author (https://kokizzu.blogspot.com/2021/11/databases-with-automatic-rebalance.html) but this kind of test with high saturation (1000 coroutines and database on the same machine) cannot have reproducible results. Especially when run a few seconds on small dataset which even fit in CPU cache.
Here is the load during my test:
[opc@8ocpu ~]$ sudo vmstat -twSm 10
procs -----------------------memory---------------------- ---swap-- -----io---- -system-- --------cpu-------- -----timestamp-----
 r  b         swpd         free         buff        cache   si   so    bi    bo   in   cs  us  sy  id  wa  st                 GMT
 0  0            0        60374            3         5058    0    0     3    55  101  110   2   1  97   0   0 2021-11-18 13:07:39
30  0            0        60499            3         5078    0    0    19  1476 50434 135782  23  16  61   0   0 2021-11-18 13:07:49
28  0            0        60377            3         5116    0    0     0  3480 122324 344813  52  39   8   0   0 2021-11-18 13:07:59
40  0            0        60256            3         5153    0    0     0  3529 120405 339132  52  39   9   0   1 2021-11-18 13:08:09
45  0            0        60149            3         5190    0    0     0  4191 120933 340703  52  39   9   0   1 2021-11-18 13:08:19
16  1            0        60039            3         5227    0    0     0  5000 123419 339480  52  38   9   0   1 2021-11-18 13:08:29
25  0            0        59917            3         5262    0    0     0  3204 111062 320184  53  36  11   0   0 2021-11-18 13:08:39
53  0            0        59817            3         5298    0    0     0  3466 113525 328796  54  37   8   0   0 2021-11-18 13:08:49
38  0            0        59728            3         5334    0    0     0  4661 116244 326785  55  37   8   0   0 2021-11-18 13:08:59
36  0            0        59636            3         5370    0    0     0  3375 114145 328448  54  37   8   0   1 2021-11-18 13:09:09
32  0            0        59551            3         5406    0    0     0  3442 113705 327621  55  36   8   0   1 2021-11-18 13:09:19
18  0            0        59476            3         5437    0    0     0  4352 113995 309913  51  35  13   0   1 2021-11-18 13:09:29
 0  0            0        59988            3         5431    0    0     0    64 102598 208398  36  31  33   0   0 2021-11-18 13:09:39
I have 16 vCPU on this VM and the number of runnable processes is always higher. In real life, you use a connection pooler that is sized accordingly to the database server. Here, the default is 16 client sessions. Because the default for pgxpool is the number of vCPU (or 4 when we have less vCPU) - see https://github.com/jackc/pgx/blob/v4.13.0/pgxpool/pool.go#L277
Side note: Always set the connection pool according to the server resources. The goal of a connection pool is to backpressure when the database server is overloaded, because it is better to queue the calls before they hold latches and locks. When you increase the application server vCPU, the connection pool should not increase over what the database server can handle.
DocDB statistics
In order to understand the work done in the storage layer, I query some statistics available from the metrics endpoint. I have an ugly one-liner to show some rocksdb statistics per second:
RE="(rocksdb_number|inserted).*bar1" ; FQ=10 ; while sleep $FQ ; do echo ; curl -qs http://localhost:9000/metrics | jq -r '.[]|(.attributes.namespace_name+"."+.attributes.table_name+"/"+.id) as $table|select(.type=="tablet" and .attributes.namespace_name!="system")|.metrics[]|select(.value>0)|.name+"\""+$table+"\""+(.value|tostring)' | awk -F'"' "/${RE}/"'{sub("/.*","",$2);s[$1qq$2]=s[$1qq$2]+$3}END{for(i in s){print i qq s[i]}}' qq='"' | sort -t'"' -k2,1 ; done | awk -F'"' '/^$/{b=1}$3>v[$1,$2]{if(b>0)print "";printf "%18d %-50s %15g%1s %-s\n",($3-v[$1,$2])/fq,$1,$3,h[p-1],$2;v[$1,$2]=$3;b=0}' fq=$FQ
The result during the INSERT phase is:
6630 rocksdb_number_db_seek_found 2.38639e+06  yugabyte.bar1
6625 rocksdb_number_db_seek_found 1.98624e+06  yugabyte.bar1_foo_key
6632 rocksdb_number_db_seek       2.38721e+06  yugabyte.bar1
6627 rocksdb_number_db_seek       1.98712e+06  yugabyte.bar1_foo_key
4421 rocksdb_number_keys_written       724746  yugabyte.bar1
4419 rocksdb_number_keys_written  1.12471e+06  yugabyte.bar1_foo_key
4421 rows_inserted                     724770  yugabyte.bar1
4418 rows_inserted                1.12474e+06  yugabyte.bar1_foo_key
I have approximately 4.4 thousand "rows_inserted" per second into the table (yugabyte.bar1), and the same in the index (yugabyte.bar1_foo_key). You may wonder why the insert of 100000 rows doesn't take 100000/4421=22 seconds but 45 seconds. The reason is that those statistics are at DocDB level where we have one key-value per column. The 2200 SQL rows inserted per second whow up there as 4400 rocksdb subdocuments insertions in the LSM Tree.
And then, in this DocDB layer which is based on RocksDB, data is stored in a sorted structure. Ordered on the primary key for the table, and on the key columns for the index. This means that accessing to a key, for read or write, needs to 'seek' to the key value, and those are the rocksdb_number_db_seek. Now, looking at this metric, I see about 6600 per second. We have seen 4400 writes and those may require a seek into the sorted structure. What are the additional 2200? This is where the YSQL API is different than the YCQL. In a NoSQL database, an insert can replace an existing row with a new version of it. This is a write-only operation. However, in a SQL database, an insert has to verify the existence of the key in order to return. This requires an additional read for the key, and here are the 2200 additional seeks per second to server those 2200 SQL inserts per second.
I'll not go into further details here. I'm convinced that we need to understand what happens in a benchmark and here, all works as expected in SQL for an insert on a 2 columns table with one additional index.
Connection Pool
I have run some variations on the connection pool size:
for i in 1{0..10} ; do sed -e '/pgUrl :=/s/%s[^%]*"$/%s?pool_max_conns='$i'"/' -i hugedbbench/2021/yugabytedb/main_test.go ; /var/tmp/go/bin/go test -v hugedbbench/2021/yugabytedb/main_test.go ; sleep 10 ; done | grep PASS

--- PASS: TestDb (128.57s)
    --- PASS: TestDb/insert (49.91s)
    --- PASS: TestDb/update (65.89s)
    --- PASS: TestDb/select (11.73s)
--- PASS: TestDb (126.08s)
    --- PASS: TestDb/insert (48.87s)
    --- PASS: TestDb/update (64.80s)
    --- PASS: TestDb/select (11.20s)
--- PASS: TestDb (123.52s)
    --- PASS: TestDb/insert (47.96s)
    --- PASS: TestDb/update (63.64s)
    --- PASS: TestDb/update (63.64s)
    --- PASS: TestDb/select (10.78s)
--- PASS: TestDb (121.07s)
    --- PASS: TestDb/insert (47.03s)
    --- PASS: TestDb/update (62.60s)
    --- PASS: TestDb/select (10.28s)
--- PASS: TestDb (119.72s)
    --- PASS: TestDb/insert (46.75s)
    --- PASS: TestDb/update (61.60s)
    --- PASS: TestDb/select (10.19s)
--- PASS: TestDb (117.68s)
    --- PASS: TestDb/insert (46.00s)
    --- PASS: TestDb/update (60.58s)
    --- PASS: TestDb/select (9.96s)
--- PASS: TestDb (116.43s)
    --- PASS: TestDb/insert (45.54s)
    --- PASS: TestDb/update (60.00s)
    --- PASS: TestDb/select (9.70s)
--- PASS: TestDb (114.81s)
    --- PASS: TestDb/insert (45.00s)
    --- PASS: TestDb/update (59.09s)
    --- PASS: TestDb/select (9.55s)
--- PASS: TestDb (114.23s)
    --- PASS: TestDb/insert (44.80s)
    --- PASS: TestDb/update (58.73s)
    --- PASS: TestDb/select (9.53s)
--- PASS: TestDb (113.07s)
    --- PASS: TestDb/insert (44.29s)
    --- PASS: TestDb/update (58.34s)
    --- PASS: TestDb/select (9.21s)
--- PASS: TestDb (101.80s)
    --- PASS: TestDb/insert (40.28s)
    --- PASS: TestDb/update (52.55s)
    --- PASS: TestDb/select (7.70s)
No big difference here, but it is interesting that even at CPU saturation we get better throughput. However, what matters in a real-life scenario for such small queries is the response time. It is not measured here, but this is what matters for the end-users. A benchmark should reach the maximum throughput within the acceptable latency.
Database size
The benchmark page mentions the size of the database, and that's interesting because there is some write amplification in LSM Trees, but the SSTables are compressed:
25M     2021/yugabytedb/ybmaster1
519M    2021/yugabytedb/ybtserver1
However, there are many things in this directory. What the console shows after my run is:
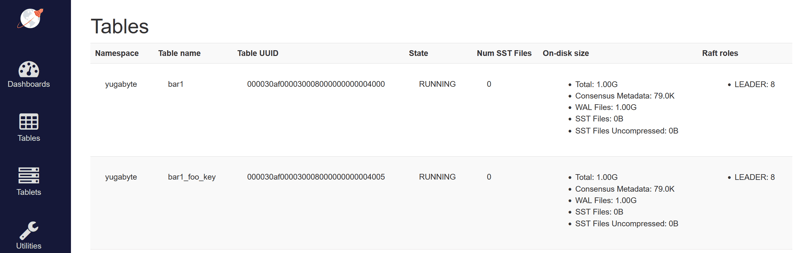
Yes, you read it correctly, zero bytes of data on disk for this tables (and index). The first level of the YugabyteDB storage is the MemTable - nothing in datafiles. Of course, this is protected by WAL for committed transactions (which are in this 519M directory, but other files, like text logs, are there). This benchmark is too small to look at the size of the database.
Flamegraph
I gathered the callstacks during the Insert phase:
# record perf samples during 1 minutes (run on the yugabyte server while the program is running)
sudo perf record --call-graph fp -F99 -e cpu-cycles -a sleep 30
# get Brendan Gregg flamegraph tool
git clone https://github.com/brendangregg/FlameGraph.git
# get my color map for YugabyteDB and PostgreSQL functions
wget -c https://raw.githubusercontent.com/FranckPachot/ybio/main/util_flamegraph/palette.map
# generate flamegraph on the recorded perf.data as perf.svg
sudo perf script -i perf.data | FlameGraph/stackcollapse-perf.pl | FlameGraph/flamegraph.pl --colors green --width=2400 --hash --cp | tee perf.svg && chmod a+r perf.svg
# here is how to share it though internet:
echo $(curl --upload-file perf.svg http://transfer.sh/$(date +%Y%m%dT%H%M%S).svg)
# the url displayed can be opened publicly
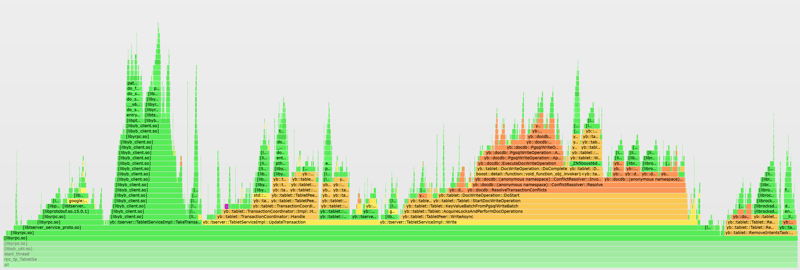
The .svg shows lot of CPU time on transactions:
With such a small set of data, all is done in the MemTables, with transaction information, intents and regular records. And all the sessions competing on the same blocs because all on the same table. In real life, the tables will be larger and distributed over more space.
This postgresql driver is apparently is set with autocommit by default. So finally this workload spends more time in client/server roundtrips and transaction management, without really pressuring the distributed storage.
Statements
We can see the code of the benchmark in the Go source, but it is a good idea to look at the statement statistics in the database to see if it matches:
yugabyte=# select * from pg_stat_statements;

 userid | dbid  |       queryid        |                                     query                                      | calls  |    total_time    |  min_time  |  max_time  |     mean_time     |    stddev_time    |  rows  | shared_blks_hit | shared_blks_read | shared_blks_dirtied | shared_blks_written | local_blks_hit | local_blks_read | local_blks_dirtied | local_blks_written | temp_blks_read | temp_blks_written | blk_read_time | blk_write_time
--------+-------+----------------------+--------------------------------------------------------------------------------+--------+------------------+------------+------------+-------------------+-------------------+--------+-----------------+------------------+---------------------+---------------------+----------------+-----------------+--------------------+--------------------+----------------+-------------------+---------------+----------------
  12462 | 12463 | -2087269522024648011 | UPDATE bar1 SET foo=$1 WHERE id=$2                                             | 100000 |    485477.712469 |   1.915087 |  34.455194 |  4.85477712468993 |  1.36353370045271 | 100000 |               0 |                0 |                   0 |                   0 |              0 |               0 |                  0 |                  0 |              0 |                 0 |             0 |              0
  12462 | 12463 | -6847975773612843604 | SELECT foo FROM bar1 WHERE id=$1                                               | 100000 | 75264.9602379991 |   0.357716 |  17.283995 | 0.752649602380002 | 0.309942436819194 | 100000 |               0 |                0 |                   0 |                   0 |              0 |               0 |                  0 |                  0 |              0 |                 0 |             0 |              0
  12462 | 12463 |  1653291991961171069 | INSERT INTO bar1(id,foo) VALUES($1,$2)                                         | 100000 | 304378.981981998 |   1.199272 |  21.176114 |  3.04378981982001 | 0.975275534448156 | 100000 |               0 |                0 |                   0 |                   0 |              0 |               0 |                  0 |                  0 |              0 |                 0 |             0 |              0
  12462 | 12463 |  -251734323482311315 | CREATE TABLE IF NOT EXISTS bar1(id BIGINT PRIMARY KEY, foo VARCHAR(10) UNIQUE) |      1 |       609.424784 | 609.424784 | 609.424784 |        609.424784 |                 0 |      0 |               0 |                0 |                   0 |                   0 |              0 |               0 |                  0 |                  0 |              0 |                 0 |             0 |              0
  12462 | 12463 |  2931967268591497001 | SELECT COUNT($1) FROM bar1                                                     |      2 |       355.109703 | 170.105431 | 185.004272 |       177.5548515 |         7.4494205 |      2 |               0 |                0 |                   0 |                   0 |              0 |               0 |                  0 |                  0 |              0 |                 0 |             0 |              0
  12462 | 12463 |  6265258218011740844 | TRUNCATE TABLE bar1                                                            |      1 |       171.860512 | 171.860512 | 171.860512 |        171.860512 |                 0 |      0 |               0 |                0 |                   0 |                   0 |              0 |               0 |                  0 |                  0 |              0 |                 0 |             0 |              0
(6 rows)
I didn't check further but the execution plans look good, and I already know that from the insert and seek statistics.
prepared statements
I checked that pgxpool is using prepared statement, and this is ok - once the statements prepared e see only bind ('B') calls:
strace -e trace=write -f -yy -s 1000 /var/tmp/go/bin/go test -v hugedbbench/2021/yugabytedb/main_test.go 2>&1 | grep 5433
...
[pid 13787] write(7<TCP:[127.0.0.1:37696->127.0.0.1:5433]>, "B\0\0\0001\0lrupsc_14_0\0\0\2\0\0\0\0\0\2\0\0\0\49612\0\0\0\n5d65g---9q\0\0D\0\0\0\6P\0E\0\0\0\t\0\0\0\0\0S\0\0\0\4", 72) = 72
[pid 13791] write(8<TCP:[127.0.0.1:37676->127.0.0.1:5433]>, "B\0\0\0001\0lrupsc_5_0\0\0\2\0\0\0\0\0\2\0\0\0\00562236\0\0\0\n5d65g---9r\0\0D\0\0\0\6P\0E\0\0\0\t\0\0\0\0\0S\0\0\0\4", 72) = 72
[pid 13781] write(3<TCP:[127.0.0.1:37588->127.0.0.1:5433]>, "B\0\0\0000\0lrupsc_1_0\0\0\2\0\0\0\0\0\2\0\0\0\0043815\0\0\0\n5d65g---9s\0\0D\0\0\0\6P\0E\0\0\0\t\0\0\0\0\0S\0\0\0\4", 71) = 71
[pid 13791] write(18<TCP:[127.0.0.1:37680->127.0.0.1:5433]>, "B\0\0\0002\0lrupsc_10_0\0\0\2\0\0\0\0\0\2\0\0\0\00512309\0\0\0\n5d65g---9t\0\0D\0\0\0\6P\0E\0\0\0\t\0\0\0\0\0S\0\0\0\4", 73) = 73
[pid 13715] write(12<TCP:[127.0.0.1:37710->127.0.0.1:5433]>, "B\0\0\0002\0lrupsc_13_0\0\0\2\0\0\0\0\0\2\0\0\0\588323\0\0\0\n5d65g---9u\0\0D\0\0\0\6P\0E\0\0\0\t\0\0\0\0\0S\0\0\0\4", 73) = 73
[pid 13787] write(15<TCP:[127.0.0.1:37700->127.0.0.1:5433]>, "B\0\0\0001\0lrupsc_9_0\0\0\2\0\0\0\0\0\2\0\0\0\00543752\0\0\0\n5d65g---9v\0\0D\0\0\0\6P\0E\0\0\0\t\0\0\0\0\0S\0\0\0\4", 72 <unfinished ...>
[pid 13781] write(14<TCP:[127.0.0.1:37668->127.0.0.1:5433]>, "B\0\0\0001\0lrupsc_4_0\0\0\2\0\0\0\0\0\2\0\0\0\00572627\0\0\0\n5d65g---9w\0\0D\0\0\0\6P\0E\0\0\0\t\0\0\0\0\0S\0\0\0\4", 72 <unfinished ...>
I think that the same workload running longer, with larger tables, and connecting to all nodes can scale on YugabyteDB. And my guess is that when a node fails, the sessions connected to this node will have to reconnect (handled by the connection pool) and the read/writes to the tablets that had their leader on the failed node (so one third of them) will wait 3 seconds for the Raft consensus to elect a new leader on the surviving nodes. The other will not even know that a node failed.
Summary
In conclusion, this benchmark is a good start and the goal of the author is to test the performance when one node is down. I think we need longer tests for that. And ideally multiple VMs because real-life HA requires multiple failure zones, which can add some latency. This workload stresses more the transactions, because it commits each row, than the data. There are no good or bad benchmarks but it is important to understand what is pressured in order to extrapolate to real-life use cases.


Top comments (0)