Overview
One of the things we all end up needing to do at some point in our career is creating custom charts. One of the approaches we can take is to create charts with SVG's.
And today I'm going to use React Native together with react-native-svg, obviously there are other bookstores that do the same but I'm only going to use this one because it's the one I feel more confident working with.
Today's example
Today we are going to create a chart that will take into account two values, the amount of money we have available to spend and how much we have already spent.
Let's code
Let's install the following dependencies:
npm install react-native-svg
Now we can start working on our component.
// @src/App.js
import React from 'react';

const App = () => {
  return (
    // ...
  );
};

export default App;
Then we will import the View component and StyleSheet from React Native to create our container.
// @src/App.js
import React from 'react';
import { View, StyleSheet } from "react-native";

const App = () => {
  return (
    <View style={styles.container}>
      // ...
    </View>
  );
};

export default App;


const styles = StyleSheet.create({
  container: {
    flex: 1,
    justifyContent: "center",
    alignItems: "center",
  },
});
Next we will create our chart wrapper which will contain the chart and the amount that has already been spent.
// @src/App.js
import React from 'react';
import { View, StyleSheet } from "react-native";

const App = () => {
  return (
    <View style={styles.container}>
      <View style={styles.graphWrapper}>
        // ...
      </View>
    </View>
  );
};

export default App;


const styles = StyleSheet.create({
  container: {
    flex: 1,
    justifyContent: "center",
    alignItems: "center",
  },
  graphWrapper: {
    alignItems: "center",
    justifyContent: "center",
  },
});
Now let's import Svg, G (Group) and Circle from react-native-svg, so we can start working on our chart.
// @src/App.js
import React from 'react';
import { View, StyleSheet } from "react-native";
import Svg, { G, Circle } from "react-native-svg";

const App = () => {
  return (
    <View style={styles.container}>
      <View style={styles.graphWrapper}>
        // ...
      </View>
    </View>
  );
};

export default App;


const styles = StyleSheet.create({
  container: {
    flex: 1,
    justifyContent: "center",
    alignItems: "center",
  },
  graphWrapper: {
    alignItems: "center",
    justifyContent: "center",
  },
});
But first we have to start working on our data, so let's define the radius of the circle and the circumference of the circle.
// @src/App.js
import React from 'react';
import { View, StyleSheet } from "react-native";
import Svg, { G, Circle } from "react-native-svg";

const App = () => {
  const radius = 70;
  const circleCircumference = 2 * Math.PI * radius;

  return (
    <View style={styles.container}>
      <View style={styles.graphWrapper}>
        // ...
      </View>
    </View>
  );
};

export default App;


const styles = StyleSheet.create({
  container: {
    flex: 1,
    justifyContent: "center",
    alignItems: "center",
  },
  graphWrapper: {
    alignItems: "center",
    justifyContent: "center",
  },
});
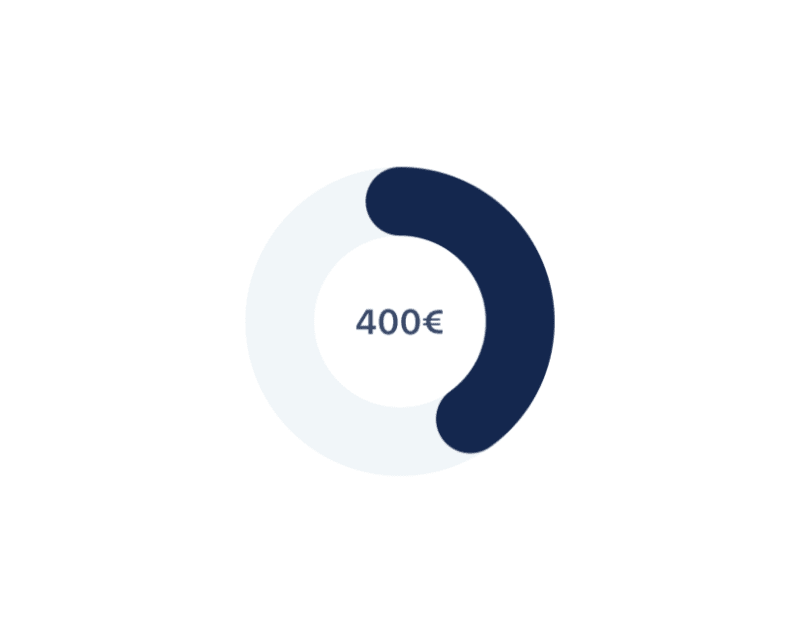
Then we will define two amounts, one will be the amount we have to spend and the other will be the amount we have to spend.
// @src/App.js
import React from 'react';
import { View, StyleSheet } from "react-native";
import Svg, { G, Circle } from "react-native-svg";

const App = () => {
  const radius = 70;
  const circleCircumference = 2 * Math.PI * radius;

  const leftToSpendAmount = 600;
  const targetAmount = 1000;

  return (
    <View style={styles.container}>
      <View style={styles.graphWrapper}>
        // ...
      </View>
    </View>
  );
};

export default App;


const styles = StyleSheet.create({
  container: {
    flex: 1,
    justifyContent: "center",
    alignItems: "center",
  },
  graphWrapper: {
    alignItems: "center",
    justifyContent: "center",
  },
});
After this we will calculate the amount that has been spent and we will calculate the percentage of the amount that has been spent so far.
// @src/App.js
import React from 'react';
import { View, StyleSheet } from "react-native";
import Svg, { G, Circle } from "react-native-svg";

const App = () => {
  const radius = 70;
  const circleCircumference = 2 * Math.PI * radius;

  const leftToSpendAmount = 600;
  const targetAmount = 1000;

  const spentAmount = targetAmount - leftToSpendAmount;
  const percentage = (spentAmount / targetAmount) * 100;

  return (
    <View style={styles.container}>
      <View style={styles.graphWrapper}>
        // ...
      </View>
    </View>
  );
};

export default App;


const styles = StyleSheet.create({
  container: {
    flex: 1,
    justifyContent: "center",
    alignItems: "center",
  },
  graphWrapper: {
    alignItems: "center",
    justifyContent: "center",
  },
});
Now the only value we're missing is the stroke value that will be filled in on the circumference and this will show the amount that has been spent so far.
// @src/App.js
import React from 'react';
import { View, StyleSheet } from "react-native";
import Svg, { G, Circle } from "react-native-svg";

const App = () => {
  const radius = 70;
  const circleCircumference = 2 * Math.PI * radius;

  const leftToSpendAmount = 600;
  const targetAmount = 1000;

  const spentAmount = targetAmount - leftToSpendAmount;
  const percentage = (spentAmount / targetAmount) * 100;
  const strokeDashoffset =
    circleCircumference - (circleCircumference * percentage) / 100;

  return (
    <View style={styles.container}>
      <View style={styles.graphWrapper}>
        // ...
      </View>
    </View>
  );
};

export default App;


const styles = StyleSheet.create({
  container: {
    flex: 1,
    justifyContent: "center",
    alignItems: "center",
  },
  graphWrapper: {
    alignItems: "center",
    justifyContent: "center",
  },
});
Now we can start working on our chart. First let's establish the screen space that will be used, using the Svg tag.
// @src/App.js
import React from 'react';
import { View, StyleSheet } from "react-native";
import Svg, { G, Circle } from "react-native-svg";

const App = () => {
  const radius = 70;
  const circleCircumference = 2 * Math.PI * radius;

  const leftToSpendAmount = 600;
  const targetAmount = 1000;

  const spentAmount = targetAmount - leftToSpendAmount;
  const percentage = (spentAmount / targetAmount) * 100;
  const strokeDashoffset =
    circleCircumference - (circleCircumference * percentage) / 100;

  return (
    <View style={styles.container}>
      <View style={styles.graphWrapper}>
        <Svg height="160" width="160" viewBox="0 0 180 180">
          // ...
        </Svg>
      </View>
    </View>
  );
};

export default App;


const styles = StyleSheet.create({
  container: {
    flex: 1,
    justifyContent: "center",
    alignItems: "center",
  },
  graphWrapper: {
    alignItems: "center",
    justifyContent: "center",
  },
});
Now we're going to use the G tag and we're going to define an axis and then give it a little rotation. The use of this tag is due to the fact that we will have two circles, one will represent the total amount and the other will show the amount spent.
// @src/App.js
import React from 'react';
import { View, StyleSheet } from "react-native";
import Svg, { G, Circle } from "react-native-svg";

const App = () => {
  const radius = 70;
  const circleCircumference = 2 * Math.PI * radius;

  const leftToSpendAmount = 600;
  const targetAmount = 1000;

  const spentAmount = targetAmount - leftToSpendAmount;
  const percentage = (spentAmount / targetAmount) * 100;
  const strokeDashoffset =
    circleCircumference - (circleCircumference * percentage) / 100;

  return (
    <View style={styles.container}>
      <View style={styles.graphWrapper}>
        <Svg height="160" width="160" viewBox="0 0 180 180">
          <G rotation={-90} originX="90" originY="90">
            // ...
          </G>
        </Svg>
      </View>
    </View>
  );
};

export default App;


const styles = StyleSheet.create({
  container: {
    flex: 1,
    justifyContent: "center",
    alignItems: "center",
  },
  graphWrapper: {
    alignItems: "center",
    justifyContent: "center",
  },
});
Now let's create our first circle, this circle will represent the total amount, so we'll pass the radius value as a prop, let's define a color and stroke thickness.
// @src/App.js
import React from 'react';
import { View, StyleSheet } from "react-native";
import Svg, { G, Circle } from "react-native-svg";

const App = () => {
  const radius = 70;
  const circleCircumference = 2 * Math.PI * radius;

  const leftToSpendAmount = 600;
  const targetAmount = 1000;

  const spentAmount = targetAmount - leftToSpendAmount;
  const percentage = (spentAmount / targetAmount) * 100;
  const strokeDashoffset =
    circleCircumference - (circleCircumference * percentage) / 100;

  return (
    <View style={styles.container}>
      <View style={styles.graphWrapper}>
        <Svg height="160" width="160" viewBox="0 0 180 180">
          <G rotation={-90} originX="90" originY="90">
            <Circle
              cx="50%"
              cy="50%"
              r={radius}
              stroke="#F1F6F9"
              fill="transparent"
              strokeWidth="40"
            />
            // ...
          </G>
        </Svg>
      </View>
    </View>
  );
};

export default App;


const styles = StyleSheet.create({
  container: {
    flex: 1,
    justifyContent: "center",
    alignItems: "center",
  },
  graphWrapper: {
    alignItems: "center",
    justifyContent: "center",
  },
});
Next we will create the circle that will represent the amount spent, this circle will receive the radius, the color, the stroke thickness, the value of the circumference and the stroke dash offset as a prop.
And we're going to want the corners of the stroke to be rounded.
// @src/App.js
import React from 'react';
import { View, StyleSheet } from "react-native";
import Svg, { G, Circle } from "react-native-svg";

const App = () => {
  const radius = 70;
  const circleCircumference = 2 * Math.PI * radius;

  const leftToSpendAmount = 600;
  const targetAmount = 1000;

  const spentAmount = targetAmount - leftToSpendAmount;
  const percentage = (spentAmount / targetAmount) * 100;
  const strokeDashoffset =
    circleCircumference - (circleCircumference * percentage) / 100;

  return (
    <View style={styles.container}>
      <View style={styles.graphWrapper}>
        <Svg height="160" width="160" viewBox="0 0 180 180">
          <G rotation={-90} originX="90" originY="90">
            <Circle
              cx="50%"
              cy="50%"
              r={radius}
              stroke="#F1F6F9"
              fill="transparent"
              strokeWidth="40"
            />
            <Circle
              cx="50%"
              cy="50%"
              r={radius}
              stroke="#14274E"
              fill="transparent"
              strokeWidth="40"
              strokeDasharray={circleCircumference}
              strokeDashoffset={strokeDashoffset}
              strokeLinecap="round"
            />
          </G>
        </Svg>
      </View>
    </View>
  );
};

export default App;


const styles = StyleSheet.create({
  container: {
    flex: 1,
    justifyContent: "center",
    alignItems: "center",
  },
  graphWrapper: {
    alignItems: "center",
    justifyContent: "center",
  },
});
Last but not least, just show the amount that was spent, for that we will import the React Native Text component and create styles for it.
// @src/App.js
import React from "react";
import { View, StyleSheet, Text } from "react-native";
import Svg, { G, Circle } from "react-native-svg";

const App = () => {
  const radius = 70;
  const circleCircumference = 2 * Math.PI * radius;

  const leftToSpendAmount = 600;
  const targetAmount = 1000;

  const spentAmount = targetAmount - leftToSpendAmount;
  const percentage = (spentAmount / targetAmount) * 100;
  const strokeDashoffset =
    circleCircumference - (circleCircumference * percentage) / 100;

  return (
    <View style={styles.container}>
      <View style={styles.graphWrapper}>
        <Svg height="160" width="160" viewBox="0 0 180 180">
          <G rotation={-90} originX="90" originY="90">
            <Circle
              cx="50%"
              cy="50%"
              r={radius}
              stroke="#F1F6F9"
              fill="transparent"
              strokeWidth="40"
            />
            <Circle
              cx="50%"
              cy="50%"
              r={radius}
              stroke="#14274E"
              fill="transparent"
              strokeWidth="40"
              strokeDasharray={circleCircumference}
              strokeDashoffset={strokeDashoffset}
              strokeLinecap="round"
            />
          </G>
        </Svg>
        <Text style={styles.text}>{spentAmount}€</Text>
      </View>
    </View>
  );
};

export default App;

const styles = StyleSheet.create({
  container: {
    flex: 1,
    justifyContent: "center",
    alignItems: "center",
  },
  graphWrapper: {
    alignItems: "center",
    justifyContent: "center",
  },
  text: {
    position: "absolute",
    textAlign: "center",
    fontWeight: "600",
    fontSize: 18,
    color: "#394867",
  },
});
You should get a result similar to this:
Conclusion
As always, I hope you found it interesting. If you noticed any errors in this article, please mention them in the comments. 🧑🏻💻
Hope you have a great day! 👹


Top comments (1)
Hello! your example is great but I'm trying to pass an array but I can't get it to work using a ForEach