Or: How you can use the power of Kubernetes and a good monitoring stack to do just about everything
I just got a smoker and let's say I've gone ham for it. Well, not ham, but I have had the thing for 6 weeks and have made 5 briskets. Each one is getting a little better and I'll say the experience of smoking meat is pretty fun; there's a ton you have to pay attention to and you want to make small adjustments without letting anything too dramatic happen.
Along with the smoker, I also got an iGrill v2. It's effectively a Bluetooth thermometer that has both meat and ambient temperature probes. iGrill has an app that lets you do some basic stuff but you are tied to the Bluetooth range of the little unit, which is pretty small, maybe like 30 feet on a good day. What this meant was I couldn't even walk around my house and still get the temperatures and alerts from the thermometer.
Our Goal
Create a simple way to monitor the real-time temperatures of the smoker from anywhere.
Our tech stack
- Kubernetes
- Helm
- Helmfile
-
prometheus-operator
- Prometheus
- Grafana
- Alert Manager
- Prometheus Push Gateway
- iGrill
- Raspberry Pi B+
Our solution
First, we need to connect the iGrill to something other than a phone. I have a handful of Raspberry Pi B+'s laying around that should work perfectly. They have built-in Bluetooth and BTLE.
Some people have already done the heavy lifting when it comes to talking to the iGrill, this repo by bjoernhoefer looks good, so let's start there.
import time

from igrill import IGrillV2Peripheral
from prometheus_client import Gauge, push_to_gateway, CollectorRegistry

registry = CollectorRegistry()
probe_one = Gauge('bbq_probe_one_temp', 'Temp of probe one', registry=registry)
probe_two = Gauge('bbq_probe_two_temp', 'Temp of probe two', registry=registry)
probe_three = Gauge('bbq_probe_three_temp', 'Temp of probe three', registry=registry)
probe_four = Gauge('bbq_probe_four_temp', 'Temp of probe four', registry=registry)

probes = [ probe_one, probe_two, probe_three, probe_four ]
battery = Gauge('bbq_battery', 'Battery of the iGrill', registry=registry)

if __name__ == '__main__':
    periph = IGrillV2Peripheral('XX:XX:XX:XX:XX:XX')
    while True:

        temperature=periph.read_temperature()

        # Probe 1
        if temperature[1] != 63536.0:
            print("bbq/probe1", temperature[1])
            probe_one.set(temperature[1])

        # Probe 2
        if temperature[2] != 63536.0:
            print("bbq/probe2", temperature[2])
            probe_two.set(temperature[2])

        # Probe 3
        if temperature[3] != 63536.0:
            print("bbq/probe3", temperature[3])
            probe_three.set(temperature[3])

        # Probe 4
        if temperature[4] != 63536.0:
            print("bbq/probe4", temperature[4])
            probe_four.set(temperature[4])

        print("bbq/battery", periph.read_battery())
        battery.set(periph.read_battery())
        push_to_gateway('https://grillstats-url', job="igrill", registry=registry )

        time.sleep(5)
We don't need the MQTT server. Instead, we can add Prometheus Gateway to our Kubernetes cluster and push our metrics straight there.
Now let's set up our Prometheus Operator with a sidecar that is ready to receive metrics.
In a values.yaml file we add
  -
    prometheus:
      additionalServiceMonitors:
        -
          name: igrill-monitor
          selector:
            matchLabels:
              app: prometheus-pushgateway
          namespaceSelector:
            matchNames:
              - metrics
          endpoints:
            -
              honorLabels: true
            -
              port: '9091'
            -
              targetPort: '9091'
              interval: 5s
This tells Prometheus that it should scrape new endpoints.
Last, let's set up the Prometheus Gateway to give us a place to push metrics to. We use helm to deploy the Prometheus Gateway.
We can document the whole thing with a helmfile:
  releases:
  - name: metrics
    namespace: metrics
    chart: stable/prometheus-operator
    values:
      - prometheus-node-exporter:
          service:
            port: 30206
            targetPort: 30206
      - prometheus:
          additionalServiceMonitors:
            - name: igrill-monitor
              selector:
                matchLabels:
                  app: prometheus-pushgateway
              namespaceSelector:
                matchNames:
                  - metrics
              endpoints:
                - honorLabels: true
                - port: "9091"
                - targetPort: "9091"
                  interval: 5s
  - name: push-gateway
    namespace: metrics
    chart: stable/prometheus-pushgateway
A simple helmfile sync deploys everything.
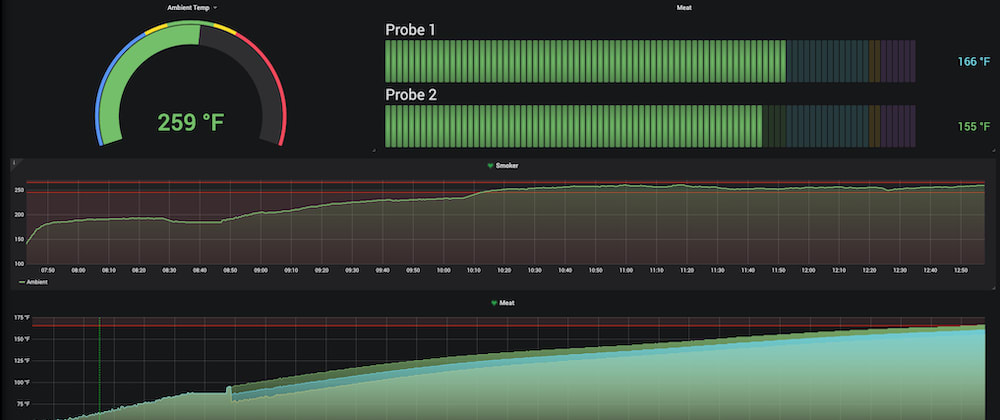
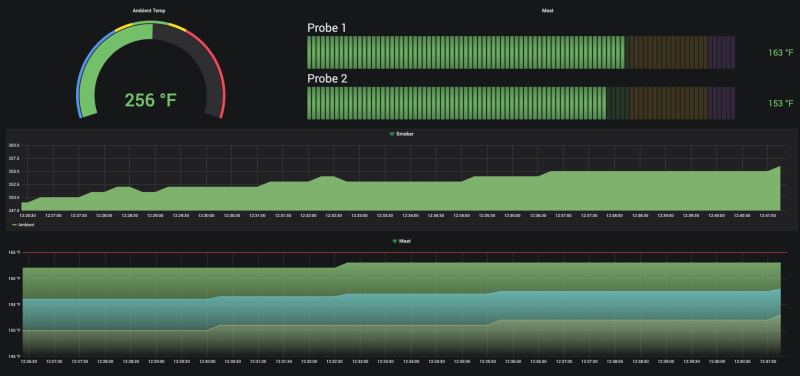
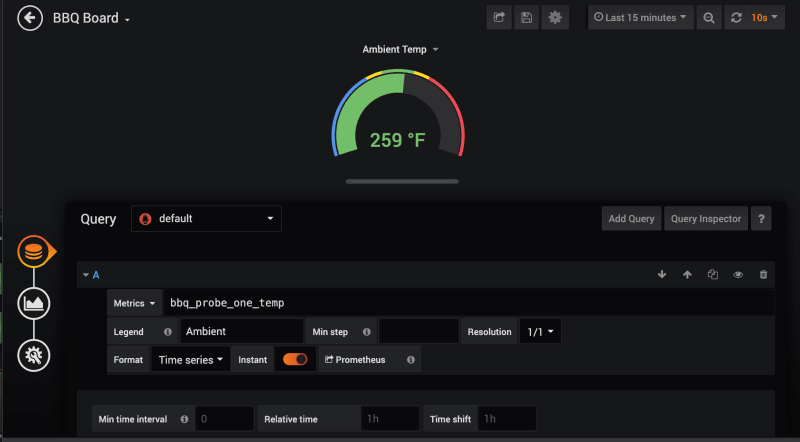
Now we can set up the charts in Grafana:
And of course - a glamor shot of the final product! Over all it took me about 14 hours to smoke and people loved it!


Top comments (2)
Thanks For Sharing This i will use in my bbq.
Share a picture when you get it set up!