In Excel, the Chart is used to show the input data into the graphical representation. After creating the chart, you can either customize the chart styles or use the predefined layout styles. Let’s see how to change the chart type in the way you want. Get an official version of ** MS Excel** from the following link: https://www.microsoft.com/en-in/microsoft-365/excel
Steps to Change Chart Style in Excel:
To change the type of chart, please see the below steps:
- First, you need to create a chart based on your input data.

- You need to right-click anywhere in the chart, it will show the list of options as per the below image.

- Here, you need to select the change chart type option from the list.

- It will display the change chart type in the new window. Here, you can see the different types of charts in the navigation.
- You can select any type of chart that you want to create and hit the OK button.
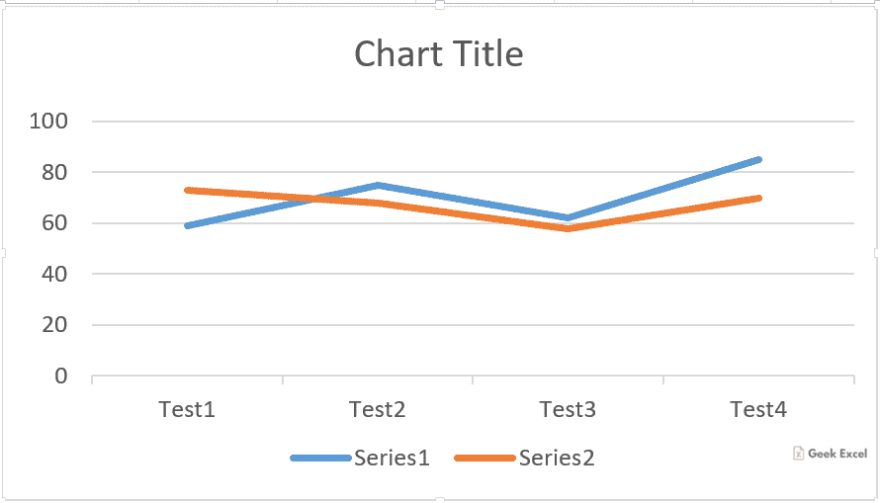
- For example, in the below image we will select the Line Chart.

After selecting the chart type, it will display the chart that you selected from the list.
Bottom-Line:
In this way, we learned the simple steps to change the chart type in Excel. Let me know if you have any doubts regarding this article or any other article on this site. To learn more, check out Geek Excel!! Thank you!!
 Design a Chart in Excel Office 365 ~ Step-by-Step Procedure!!


Top comments (0)