

After having built, secured and documented our API, we will now learn how to monitor it.
To do that we will use Prometheus and Grafana :
Prometheus will serve to collect the API metrics
Grafana will display it in panel to help to visualise the metrics
What you will need
If you have followed the previous tutorials, you will only need to install docker to host our prometheus and grafana.
Else you need a running API, you can do that with these 2 options :
pull this repository branch master
create a quickstart project with Spring initializr
installing docker
Importing Grafana and Prometheus images
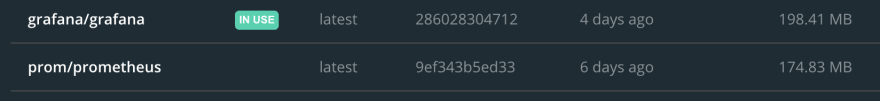
To add grafana and Prometheus to your docker local registry go to docker-hub to search them :
And then, pull then using the command line.
Normally you should see something like this in your docker CLI.
You can directly run Grafana in a container, but Prometheus will need further configuration.
Exporting our metrics to Prometheus
Firstly to export our API metric, we need to add some new dependencies to the pom.xml
<!-- Spring boot actuator to expose metrics endpoint -->
<dependency>
    <groupId>org.springframework.boot</groupId>
    <artifactId>spring-boot-starter-actuator</artifactId>
</dependency>
<!-- Micormeter core dependecy  -->
<dependency>
    <groupId>io.micrometer</groupId>
    <artifactId>micrometer-core</artifactId>
</dependency>
<!-- Micrometer Prometheus registry  -->
<dependency>
    <groupId>io.micrometer</groupId>
    <artifactId>micrometer-registry-prometheus</artifactId>
</dependency>
Actuators
The first dependency let us know of some usefulls information about our running application.
To read them we only need to start our application go to http://localhost:8080/actuator.
Prometheus
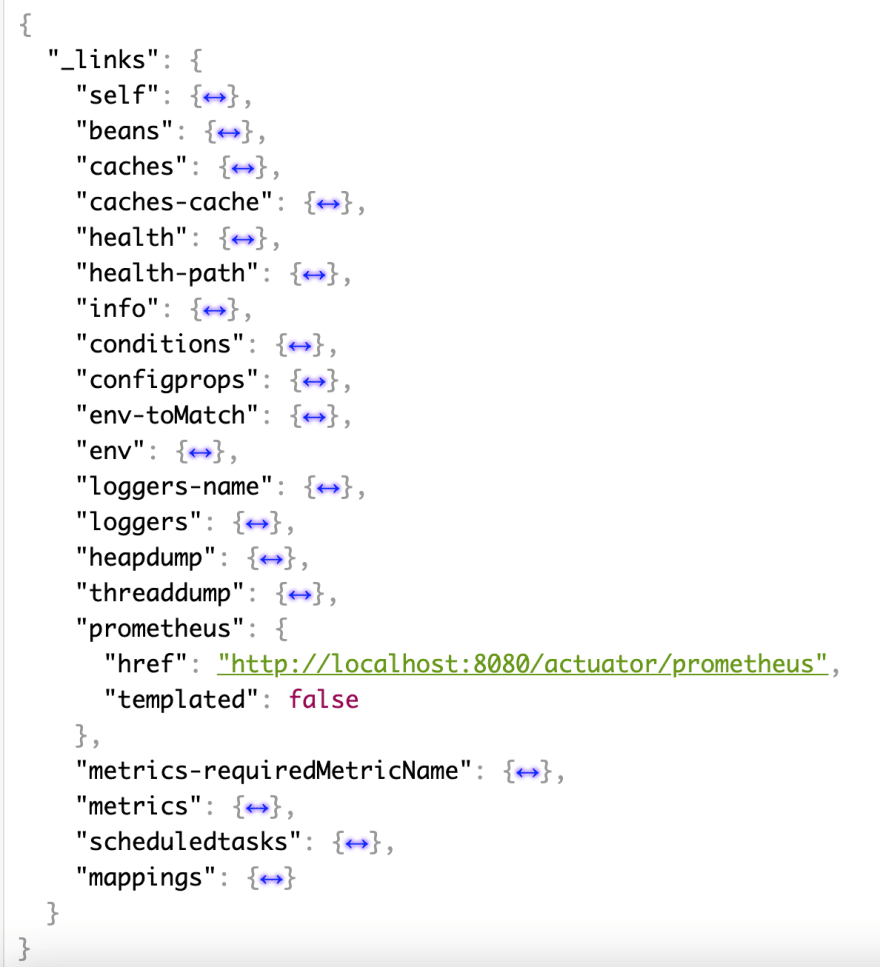
As you can see in the capture upside, with the third dependency, we have a prometheus section in our actuator.
If I follow the link i will see a list of values representing metrics from my application, like :
jvm information
http request status on endpoints
log event
…
Now that we expose our metrics to the /prometheus endpoint, we need to configure the prometheus server to collect them.
The configuration file
We need to configure our prometheus to collect data from our endpoint, to do that we need to overwrite the prometheus.yml file.
First we need to create a prometheus.yml file.
global:
  scrape_interval:     15s
  evaluation_interval: 15s

rule_files:
*# - "first_rules.yml"
# - "second_rules.yml"

*scrape_configs:
  - job_name: 'prometheus'
    static_configs:
      - targets: ['127.0.0.1:9090']

  - job_name: 'spring-actuator'
    metrics_path: '/actuator/prometheus'
    scrape_interval: 5s
    static_configs:
      - targets: ['XXXXXX:8080']
Replace the XXXXXXX by your IP adresse, as prometheus will be running in a docker container, he will not know localhost.
Secondly we will create a docker file to run prometheus with the new configuration file, myApp.dockerfile
FROM prom/prometheus
ADD prometheus.yml /etc/prometheus/prometheus.yml
With that file, we specify to docker to create a copy of the prometheus image and to add our newly created prometheus.yml to the correct directory.
Now that we collect our metrics on prometheus, we can now configure our datasource in Grafana.
Configuring Grafana
login

When you access your Grafana on your container, you arrive to a login page, to pass that page you can use the default credentials admin/admin.
Configuring the datasource
In the navigation bar on the left, when you click on the gear icon, a submenu named datasource is displayed, click on it.
Here we want to add our previously configured Prometheus as the datasource.
In the list of possible datasource, select Prometheus.
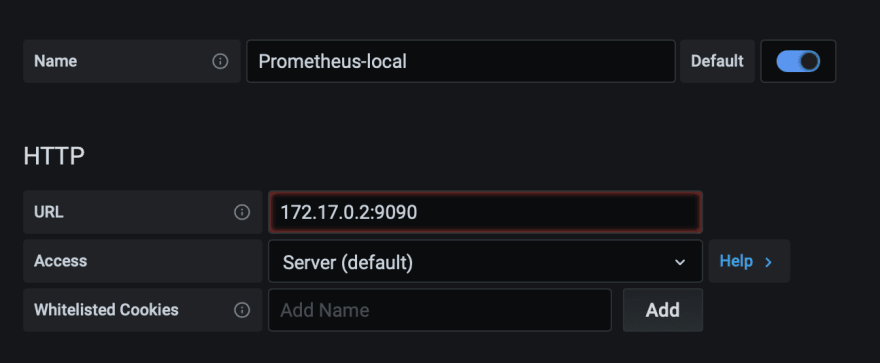
On the URL input, enter your prometheus container ip adresse.
You can test your connexion, if it’s valid you can continue to the next step, if you have error, you can read the grafana documentation to find a way to connect.
Creating dashboard
Now that we have logged into Grafana, we can produce some dashboard to display our metrics

Here I have created 4 request to display the number of HTTP request to my API endpoint by status code.
Thanks for your reading time, as previously, the code used in this tutorial is findable in this Github repository, branch monitoring.


Oldest comments (1)
Hi Erwan,
Nice article. This is Ankit from SigNoz - an open-source APM tool. We have recently launched our technical writing program and are looking for technical writers like you.
Our GitHub repo
SigNoz website
More details on our technical writing program
Couldn't find your email, feel free to reach out to me at: ankit.anand@signoz.io