I've recently finished up my second season of ML footy tipping (if you're interested, you can check out an earlier post for more context on what the hell this means), and, though I did not repeat my path to office-tipping-comp-glory (no prize money, no trash talking, at least not for me), the season was not without personal highlights. Unfortunately, they were more of the lessons-learned, character-building variety rather than the crushing-of-foes, hearing-the-lamentations-of-their-women variety. So, what have I learned over the past year to have made all the heartache of defeat worthwhile? Well, I definitely improved my machine-learning workflow and coding practices, both of which were major pain points the year before, but I also made plenty of new mistakes that will inform my goals for next year.
Got to admit: it's getting better
Last year, I wrote a post (same one linked to above) laying out the mistakes I had made when creating my first footy-tipping model and how I hoped to improve on my processes and implementations while building a new model from scratch. I ended up with the following goals:
- Do more exploratory data analysis
- Don't jump straight to fancy, complicated models
- Put some effort into code design to make extending it easier
- Come up with a better name for the model
1. Do some EDA
I had skimped on exploratory data analysis (i.e. I hadn't done any) while developing my model for 2018, relying on a brute-force method of shoveling a bunch of data on top of an algorithm till it looked right. I avoided this in the run-up to the 2019 season, looking into basic heuristics for predicting match results (e.g. always pick the home team, always pick the favourite), as well as analysing trends and the data (or lack thereof) behind momentum. One can always do more and better analysis, but I gained additional insight into Aussie Rules Football, how it's played, and what stats matter, which informed my feature building and model tuning later in the process.
2. Compare different models
Being a machine-learning novice, I had bought into the hype and started with deep learning and ensemble models without even looking at simpler linear models. I did not repeat this mistake and, though I ended up with a bagging ensemble of XGBoost models, I learned an important lesson by comparing multi-layer neural nets to linear models and basic ensembles (e.g. random forests, gradient boosters) and finding that, at least without more data, their performance was underwhelming, especially given how much longer they take to train.
3. Write better code
As the 2018 AFL season approached, my first tipping model had become a tangled mess of scripts, half-baked classes, and hard-coded values, making any extension of functionality, even something as simple as adding new columns to the data set, a herculean task on the order of cleaning out the Augean stables. I had learned much about coding best practices since then and vowed to write more-flexible code for the next model and its surrounding application. Much like EDA, one can always do better, but I'm going to count this goal as achieved as well. I did some mixing-and-matching of functional and object-oriented approaches, building pipelines with a reduced list of transformation functions, but organising the wider application with various classes. I occasionally rewrote large sections of the application to adapt to new requirements or my own changing opinions on the best way to organise the code, but the foundation was strong enough to permit this with less pain and fewer bugs than before. In particular, composing pipelines of functions that each perform one transformation was a major improvement over having a few classes whose transform methods amounted to do_all_the_feature_building_at_once.
4. Come up with a better name
Okay, at least this one is unequivocal: I nailed it. If you can't appreciate the many layers on which 'Tipresias' works, I don't know what to tell you.
Tipresias 1.0: 2019 performance
Despite the various improvements in my processes and code, the results were not exactly worthy of deification. In my office competition, which is what really matters, I finished 4th with 132 tips (i.e. correct predictions) at the end of the regular season, well behind the winner, who got 137. By the end of the season, after the confetti had been swept from Punt Road, I had 137 tips (66.18% accuracy), well behind the betting odds, which had favoured the eventual winner 140 times (67.63% accuracy). My mean absolute error (MAE) (i.e. how far off I was in predicting the winning margin) was also a bit higher at 26.77 vs 26.25 for the betting odds. This was a harder-than-average season for predicting winners, as odds-on favourites tend to win roughly 72% of the time (over the last 10 years), and the top model on Squiggle AFL got 139, whereas last year's winner got 147. It's possible that Tipresias 1.0 is particularly weak in an upset-heavy season, but it's more likely that I would have gotten subpar performance regardless of the contours of the schedule and teams' consistency. In the analysis below I'll use betting odds as a benchmark, because it's a simple, publicly-available heuristic for predicting winners that performs as well as the top, publicly-available statistical models. If I can't beat the betting odds, then I'm at a disadvantage to every Joe and Flo Schmo who has the humility to just pick the favourite from beginning to end.

This comparison of the rolling accuracy of the betting odds and Tipresias shows that both performed poorly in the early seasons, which is typical, as teams change rosters and sometimes coaches in the offseason, and it can be difficult to predict which changed for the better and which for the worse. It is also clear that Tipresias was consistently below the betting odds throughout the season, save for a single round near mid-season, and a few late in the year, which is entirely due to a particularly atrocious round 22, which had a lot of coin-flip matches of which the oddsmakers only picked three of nine and Tipresias picked seven.
Even with the anomaly of round 22, and the sudden dip in the late-teen rounds, the general trend is for accuracy to increase through the early rounds, as oddsmakers and statistical models adjust to those off-season changes, flatten around the middle of the season, then fall a little for the final third or so. Finals are a bit more difficult to predict than mid-season matches, because there is greater parity between teams (even the worst finals team is in the top half of the competition after all), but that doesn't explain the poorer accuracy in the late rounds of the regular season. A piece of conventional footy wisdom is that, as the remaining rounds fall away like shards of marble before the sculptors chisel, the shape of the season is revealed: teams get a sense of which position they'll finish at, and ones safely at the top might rest some players, increasing their chances of losing a throw-away match, and teams just out of finals contention might not do everything in their power to beat lower-ranked teams, because a few losses might result in better draft picks for next year. One of my goals for the offseason is to take a closer look at these changing dynamics across rounds and how they might affect model predictions.
Tipresias's overall performance relative to the betting odds is demonstrated even more clearly in their cumulative accuracies shown below.

Although the rolling accuracy, with a short window, shows Tipresias having a good few rounds and passing the betting odds as a result, its overall accuracy was not higher at any point during the season. Although the model's performance needs to improve in general, one area that I will be focusing on this offseason will be trying to increase accuracy in the early rounds, as there is much more room for improvement during that part of the season than later on when most heuristics and models are consistently tipping 70% - 80%. Squeezing an extra 5% - 10% accuracy out of a model that's already getting most matches right becomes increasingly difficult, and I think there are still some easier gains to be made elsewhere.
Features, features everywhere
So, which features steered Tipresias off course into the empty waste of the wine-dark sea? Since the underlying estimator is XGBoost, we can get the weights of all the features to see which had the largest impact on the model's decisions. It's possible to get these values from the model itself, but I used the model-explanation package eli5, because it offers a few functions to make extracting and visualising the underlying attributes a little easier. Even with the help of this package, I found working with an ensemble of XGBoost estimators nested in a bagging estimator nested in my own custom wrapper class a bit of a pain, which I hope to simplify for the next model to aid in analysing performance. I managed to loop over the the instances of XGBoost and average their feature weights to get a sense of which features contributed most to the final model's predictions. I used the default importance metric 'gain', in part because it's the default. Looking into it a bit more, however, I found that the other popular metric, 'weight', tends to diminish the importance of categorical variables, and I wanted to avoid that, as I believed some categories would prove influential in the model's predictions. So, below are the 20 most important features for Tipresias by gain.

What sticks out is that elo_pred_win is by far the most important feature in the model, with a gain of 0.39, compared to at_home, which is the second most important with just 0.049. Even beyond elo_pred_win, you'll notice many other features that start with elo. This is because I incorporated an Elo-based model as a group of features that I fed into the ensemble model. The problem is that since a decent statistical model is going to be better at predicting match results than almost any other single data point, it is bound to have an outsized influence on the model that it's a part of. Unfortunately, Elo underperformed even more than the betting odds or Tipresias, only achieving 60.87% accuracy (it was closer to 70% during training). So, being overly influenced by a possibly-overfitted Elo model (or one that was overly susceptible to failing in an upset-heavy season if we're being charitable) probably has something to do with Tipresias performing below expectations in 2019.
Since creating Tipresias, I've read Google's Rules of ML, which is a good, practical guide to the machine-learning development process. One rule that stuck in my mind was #40: "Keep ensembles simple". I definitely violated this rule by incorporating a statistical model into the base data set, treating it as though model outputs were of the same type as raw data about matches and players. Therefore, one of my first big changes to Tipresias will be restructuring the model into a voting ensemble rather than a bagging ensemble, so I can separate my raw data from the base models and have a clear hierarchy of inputs and outputs, finishing with the meta-estimator that will make predictions based on predictions of the sub-models. I'll have to see what the performance is like for this change, but I'm willing to accept a short-term hit in the interest of making the model easier to interpret. I'm hoping that this will offer insight into new possibilities for improving long-term performance.
I was surprised by the presence of 'Regular' and 'Finals' (i.e. whether a match was in the regular season or finals) toward the top of the feature-importance list. As I mentioned above, I want to look more closely at how predictions change during different phases of the season and if there are any tendencies that hold from year to year. The importance of these round-type features further suggests that this could be a fruitful area of investigation.
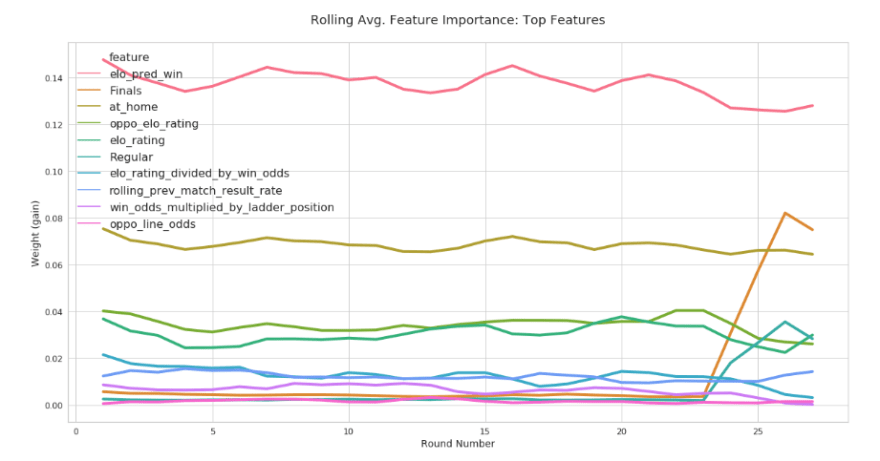
Aggregating prediction explanations by feature and round didn't prove to be particularly illuminating. We see that there isn't much movement for most of the top features save for a slight downward trend for some of the Elo-based features and a sizeable jump in the importance of round-type features with the start of finals. Again, this requires further digging, but I suspect that the model may be under-fitting the changes in context during different phases of the AFL season, optimising for the high-accuracy middle rounds and suffering poor performance early and late in the season as a result.
Tipresias 2020
Analysing the performance and pitfalls of the current version of the model offers some guidance on how I can improve performance for next season.
Make the model easier to interpret
This includes separating model-output features from raw data, and simplifying the class structure (i.e. no so many layers of wrapper classes) so that model-interpretability tools are a little easier to use. There are more packages and forms of analysis than I covered here, but I was unable to use them, because they're picky about which models they accept (BaggingEstimatorcertainly didn't play nice with most of them) and which classes are exposed to the relevant analysis functions.Investigate ways to optimise the model for different parts of the season
I will pay particular attention to the early rounds, because that's where there's the most room for a model to gain an advantage over competitors.Make better use of player data
I incorporated player stats into my model for the first time this season, but had a difficult time figuring out how best to use these features, so I ended up just aggregating rolling averages into per-team stats and calling it a day. As a result, roster changes didn't move Tipresias's predictions much (rarely more than a few points). Since a big part of teams' changes in the off-season are due to gaining or losing players, increasing the importance of these features could be part of improving early-season accuracy.Add confidence percentage as part of the predictions
This isn't related to model performance, but statistically-oriented tipping competitions include a metric called 'bits' that measures a model's error according to its confidence in a given prediction. A confidence figure comes naturally with ML classifiers, but not regressors. However, I require the predicted margin that comes with a regressor, because that is a part of all tipping competitions. One option is to add a classifier as part of the model to get an extra percentage output. A possible alternative is to learn more about conformal prediction, which is a way of adding confidence intervals to regressors. I'm still unsure of the feasibility of this approach, but it might allow me to engineer some sort of prediction confidence percentage from a regressor's output.


Top comments (0)