| Menu | Next Post: Elastic Data Frame - Inference Processor HandsOn |
Note: This HandsOn assumes that you have already followed the step-by-step Setup of your Elastic Cloud account and added the Samples available there to replicate the analysis mentioned here. If not, please, follow the steps mentioned there.
For the Classification Analysis we will use the Flights Sample dataset.
Kibana>Analytics>Dashboard>Search for and click on:[Flights] Global Flight Dashboard.
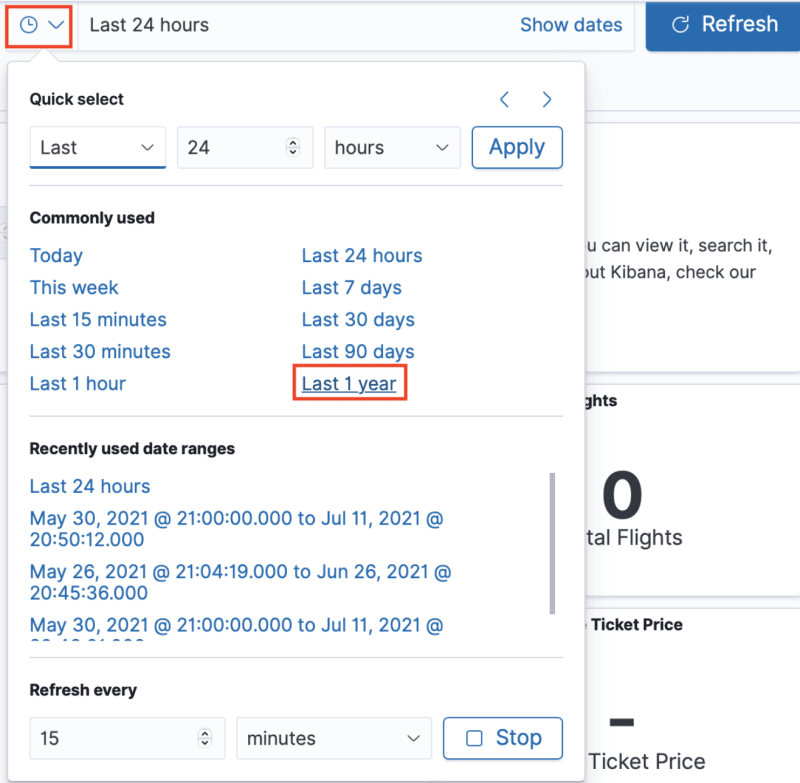
If your Dashboard is empty it is possibly because the time interval is wrong, select Last 1 year where it usually is Last 24 hours as in the image below, and the Dashboard will automatically reload.
Feel free to explore the data to understand what information we don't yet have and what might be useful to analyze. Remembering that this is just a simulation, this is not real data and the available data is limited.

An essential aspect of airport management is to closely monitor and anticipate possible flight delays and cancellations in order to prevent them whenever possible.

So, let's train a model to predict delays based on input data!
Machine Learning>Data Frame Analytics>+Create Job and search for and click on [Flights] Flight Log.
Select Classification and in the Dependent variable, variable that we will predict the class, add the boolean variable FlightDelay, as in the image below.

And then you can choose what to include or not in the analysis. Of course, the more useful data you analyze, the better the result and effectiveness, but remember not to exclude data that you are not sure about the need, because some fields that we judge to have no relation to the variable we are classifying may have some implicit relationship.
In this case, we are not going to include in the analysis data that can influence the algorithm to know the answer only with the value of directly correlated fields, I want the algorithm to use the other fields.
I will not include/select FlightDelayMin and FlightDelayType. We will not remove the Canceled boolean variable from the analysis because a delayed flight will not necessarily be canceled and we will not remove AvgTicketPrice either, maybe there is a relationship between price and delay, we don't want to exclude possibly useful fields, same thing for FlightNum.
Select the fields you want, as in the image below:

For Scatterplot Matrix, feel free to add data you want to see the relationship.
And finally add the percentage of documents destined for training and testing. 80 means that 80% of the data will be used for training and 20% for tests performed after training to test the effectiveness of the model in predicting correct results based on existing documents. But let's use 85% for training as we don't have much data. Click Continue.

In step 2, we will not change any settings at this time, but feel free to customize and click Continue.

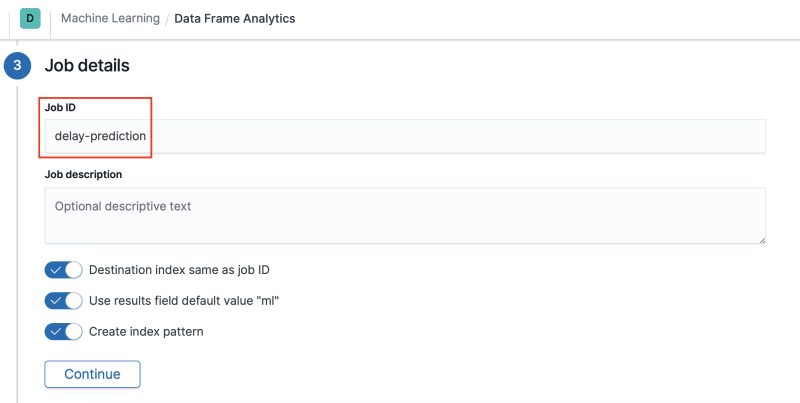
In step 3 add the name of the Job ID you want, an index pattern will be created. I will use the name: delay-prediction. Click Continue.
Your Validation should look like the image below:
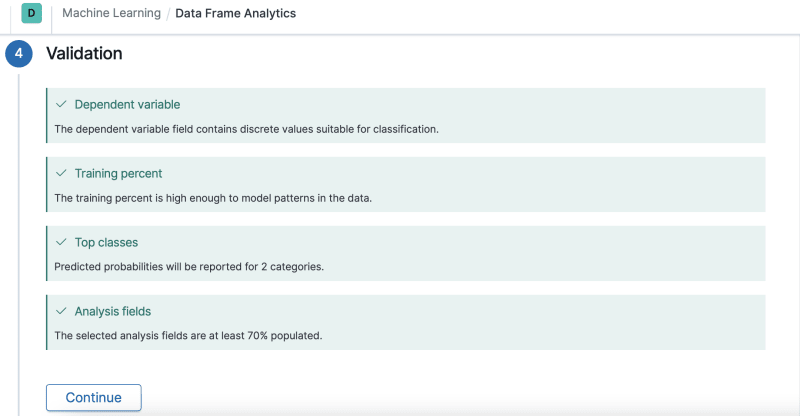
Click continue and then click Create.
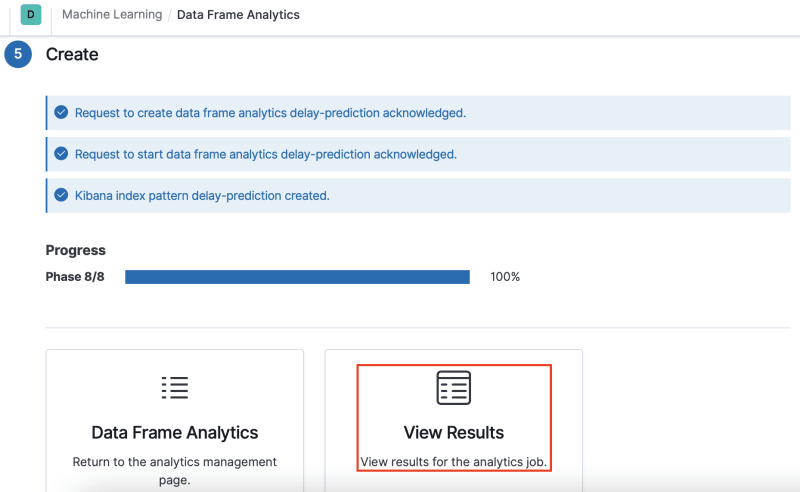
8 phases need to be loaded and you will be able to follow the progress.
When your screen looks like the image below, click View Results.
And these will be the results displayed in Kibana:

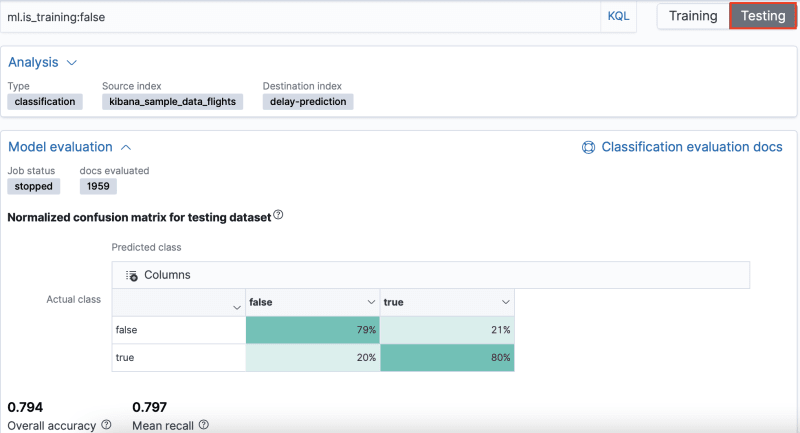
The recall value is calculated as the number of correct predictions (where the actual label matches the predicted label) divided by the sum of all the other predicted labels in that row.
And as you can see in the images above, the result was satisfactory for training and testing. It is rare to get 100% in some row of the normalized confusion matrix. But the more data for training and testing, the better. On that same page you can see the variables that most affected prediction and the Scatterplot matrix, which you can customize, as well as the results with prediction data.
But let's check the documents in our new index pattern, Kibana>Analytics>Discover and select the index pattern delay-prediction as in the image below:

Expanding a document we can see the result of the analysis, the FlightDelay field is our original field and the ml.FlightDelay_prediction field is the field that the model is predicting, in this case both fields have the same "false" value, which means that the prediction is correct.

You can also verify your model data by following these steps, in addition to accessing APIs, and using your model against incoming data.
| Menu | Next Post: Elastic Data Frame - Inference Processor HandsOn |
This post is part of a series that covers Artificial Intelligence with a focus on Elastic's (Creators of Elasticsearch) Machine Learning solution, aiming to introduce and exemplify the possibilities and options available, in addition to addressing the context and usability.


Latest comments (0)