
domolo
A monitoring and logging solution for Docker hosts and containers with Prometheus, Grafana, Loki, cAdvisor, NodeExporter and alerting with AlertManager.
Inspired by dockprom
Full source code in here
Install
Clone this repository on your Docker host, cd into domolo directory and run docker-compose up -d:
git clone https://github.com/ductnn/domolo.git
cd domolo
docker-compose up -d
Containers:
-
Prometheus (metrics database):
http://<host-ip>:9090 -
Prometheus-Pushgateway (push acceptor for ephemeral and batch jobs):
http://<host-ip>:9091 -
AlertManager (alerts management):
http://<host-ip>:9093 -
Grafana (visualize metrics):
http://<host-ip>:3000 -
Loki (likes prometheus, but for logs):
http://<host-ip>:3100 - Promtail (is the agent, responsible for gathering logs and sending them to Loki)
- NodeExporter (host metrics collector)
- cAdvisor (containers metrics collector)
- Caddy (reverse proxy and basic auth provider for prometheus and alertmanager)
Grafana
Change the credentials in file config:
GF_SECURITY_ADMIN_USER=admin
GF_SECURITY_ADMIN_PASSWORD=changeme
GF_USERS_ALLOW_SIGN_UP=false
Grafana is preconfigured with dashboards, setup Prometheus(default) and Loki in datasources
apiVersion: 1

datasources:
  - name: Prometheus
    type: prometheus
    access: proxy
    orgId: 1
    url: http://prometheus:9090
    basicAuth: false
    isDefault: true
    editable: true

  - name: Loki
    type: loki
    access: proxy
    jsonData:
      maxLines: 1000
    basicAuth: false
    url: http://loki:3100
    isDefault: false
    editable: true
Prometheus + Node Exporter
Config prometheus for receiving metrics from node_exporter. First, setup node_exporter in servers we need monitor with docker-compose.agents.yml and run command:
docker-compose -f docker-compose.agents.yml up -d
This file will setup 3 agents:
node_exportercAdvisorpromtail
Then, we need config scrape metric on prometheus server:
Live monitoring prometheus server:
scrape_configs:
  - job_name: 'nodeexporter'
    scrape_interval: 5s
    static_configs:
      - targets: ['nodeexporter:9100']
Monitoring other Server, we need to add external_labels:
external_labels:
  monitor: 'docker-host-alpha'

scrape_configs:
  - job_name: 'ApiExporter'
    scrape_interval: 5s
    static_configs:
      - targets: ['<IP Server need Monitor>:Port']
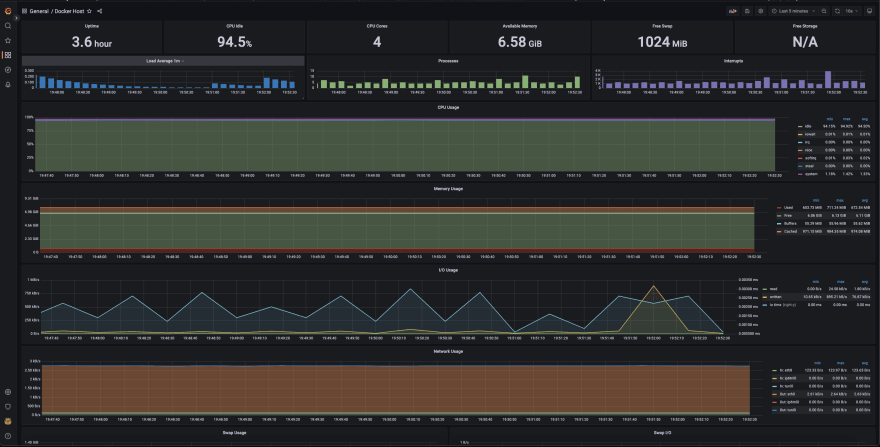
Grafana Dashboards
Simple dashboards on Grafana:
Node Exporter

Monitor Services
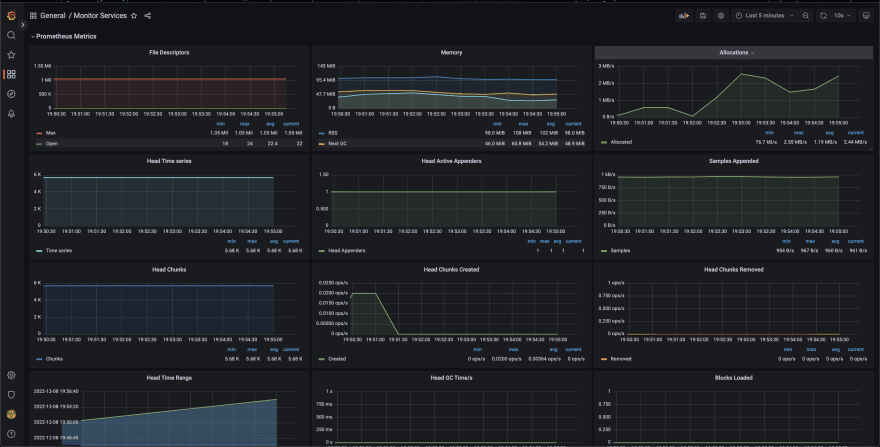
Docker Host
Loki
Setup config loki in file loki-config
TODO: Setup s3
Config scrape logs with promtail, create file promtail-config.yaml and setup:
- Scrape logs container:
- job_name: container_logs
  docker_sd_configs:
    - host: unix:///var/run/docker.sock
      refresh_interval: 5s
  relabel_configs:
    - source_labels: ['__meta_docker_container_name']
      regex: '/(.*)'
      target_label: 'container'
- Scrape logs systems:
- job_name: system
  static_configs:
  - targets:
      - localhost
    labels:
      job: varlogs
      __path__: /var/log/*log
Demo
Create simple tool generate logs and containerization this tool. Navigate to file entrypoint.sh and run test:
➜  domolo git:(master) cd fake-logs
➜  fake-logs git:(master) ✗ chmod +x entrypoint.sh
➜  fake-logs git:(master) ✗ ./entrypoint.sh
2022-12-08T13:20:00Z ERROR An error is usually an exception that has been caught and not handled.
2022-12-08T13:20:00Z DEBUG This is a debug log that shows a log that can be ignored.
2022-12-08T13:20:01Z WARN A warning that should be ignored is usually at this level and should be actionable.
2022-12-08T13:20:03Z ERROR An error is usually an exception that has been caught and not handled.
2022-12-08T13:20:05Z ERROR An error is usually an exception that has been caught and not handled.
2022-12-08T13:20:09Z INFO This is less important than debug log and is often used to provide context in the current task.
2022-12-08T13:20:13Z ERROR An error is usually an exception that has been caught and not handled.
2022-12-08T13:20:15Z DEBUG This is a debug log that shows a log that can be ignored.
2022-12-08T13:20:16Z INFO This is less important than debug log and is often used to provide context in the current task.
2022-12-08T13:20:17Z INFO This is less important than debug log and is often used to provide context in the current task.
...
Then, add fake-logs in docker-compose.yml
# Fake Logs
flogs:
  image: ductn4/flog:v1 # Set your name image :)
  build:
    context: ./fake-logs
    dockerfile: Dockerfile
  container_name: fake-logs
  restart: always
  networks:
    - monitor-net
  labels:
    org.label-schema.group: "monitoring"
or checkout docker-compose.with-flogs.yml and run command docker-compose -f docker-compose.with-flogs.yml up -d
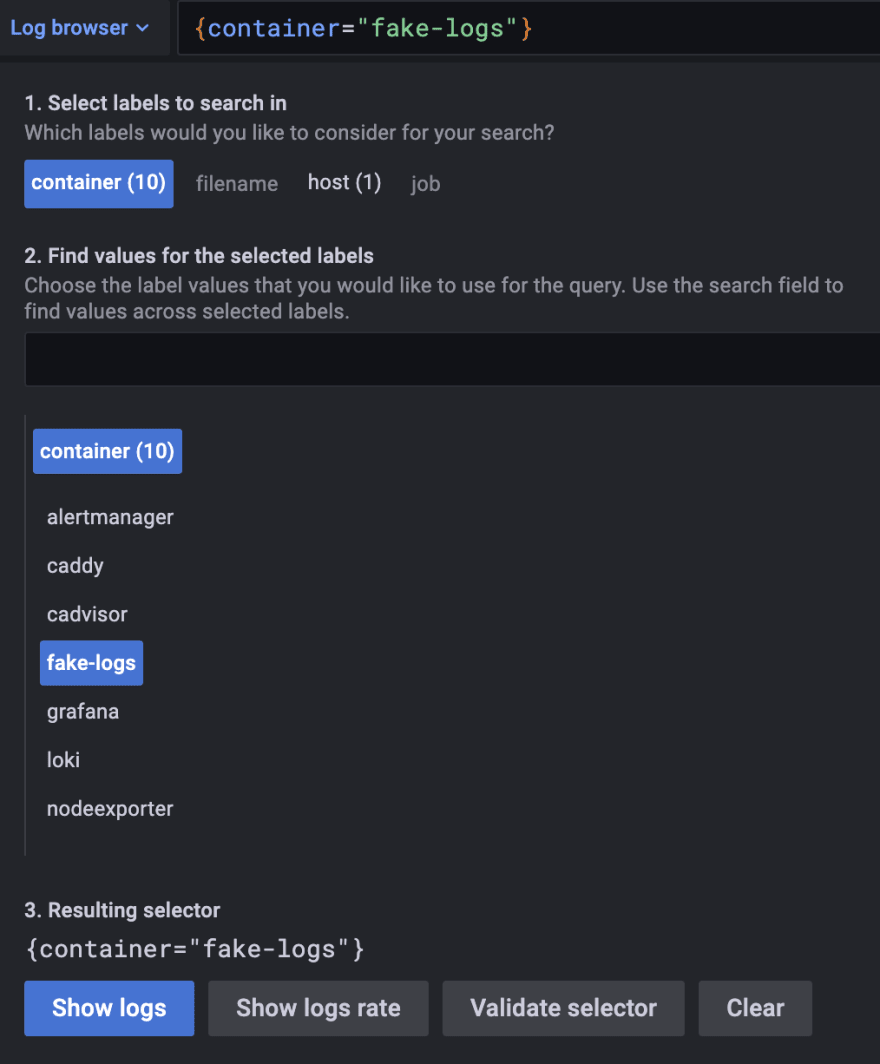
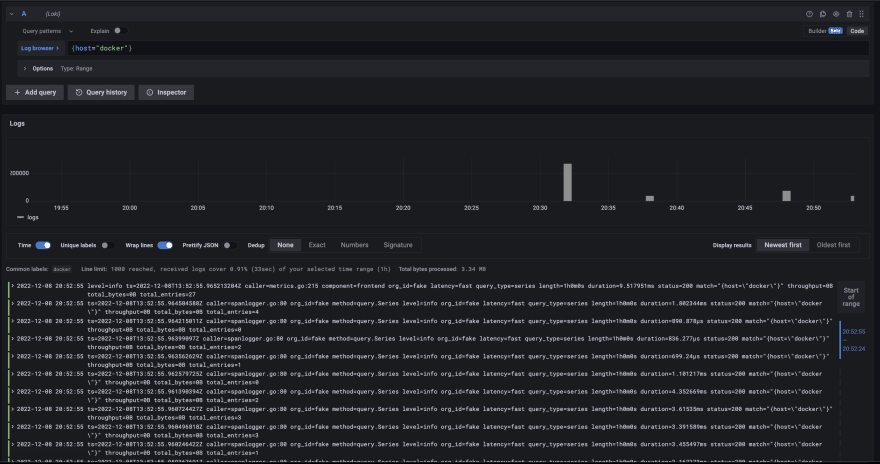
Navigate grafana and open Explore:

So, we can select labels and views logs:

Ex: Select label container and view log container fake-logs:
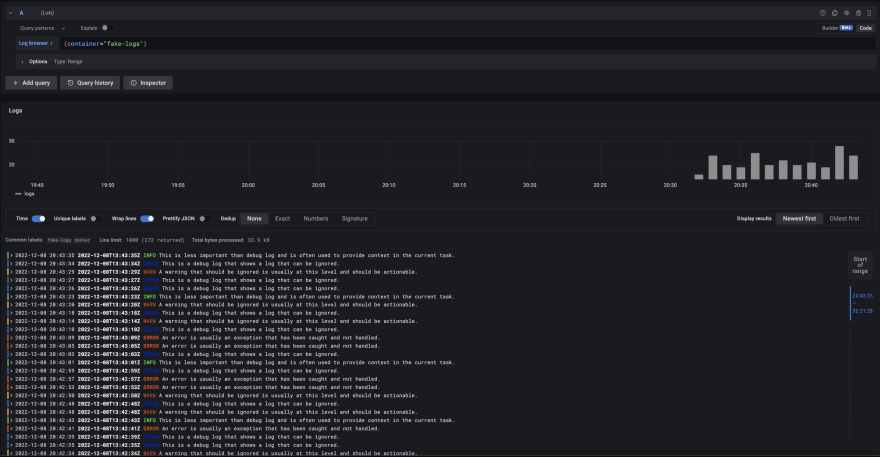
More logs: logs system, other containers, ....

Show your support
Give a ⭐ if you like this application ❤️
Contribution
All contributions are welcomed in this project!
License
The MIT License (MIT). Please see LICENSE for more information.


Oldest comments (0)