This is a writeup I've moved here from my personal website. It was originally published on 4/13/19
In my previous post, I talked about the data processing needed to turn a bunch of binaries into a dataset for use with a machine learning classifier. While I said that talking through machine learning basics is out of scope for this series, I do want to talk through a bit about how the Naive Bayes classifier works, why I’ve chosen it, and how I plan to exploit the particular way in which it handles my data to do some cool things.
If you recall, we have a dataset whose rows looks something like this:

Naive Bayes is an inference classification algorithm. Inference relies on logical properties in order to provide a guess as to how likely it is that a given observation should belong to a particular class. In our case, Naive Bayes will be telling us how likely it is that a particular basic block belongs to one of our CWE classes. It will be doing this by looking at the opcodes present in that basic block, comparing that to basic blocks that it saw when it was trained, and returning a probability for each possible CWE class indicating how likely it is to be that CWE. We can use this to do something clever.
There is something fundamentally wrong with the data. If you haven’t spotted it already, don’t worry, it’s subtle. When I created the dataset, I chose to create many observations from a single binary. Namely, I created one observation for each basic block in that binary. Vulnerabilities are generally localized to a small set of the basic blocks within a binary — however, I have labeled entire binaries with a CWE class. This means that there are many basic blocks, i.e. observations, which are incorrectly labeled, as they do not actually contain a vulnerability. That poor labeling is going to affect the training of the classifier, and in turn, adversely affect accuracy.

Knowing what I do about binaries, though, I can use our classifier to cheat a little. What I know is that binaries often have some similar code, e.g. setup and teardown code, string manipulation code, console or network code, etc. Binaries which serve similar purposes often use similar code and therefore share more similar blocks, and conversely binaries which do drastically different things have less blocks in common. I make the hypothesis that blocks that are common amongst binaries from many different CWE classes are not indicative of a vulnerability, whereas blocks which are more unique to a CWE class are good indicators of that vulnerability. Because naive Bayes is an inference algorithm, and it returns for us a probability for each CWE class when classifying a basic block, we can inspect this probability distribution at classification time and determine if that block skews heavily toward a single class or if the classifier thinks it’s seen it before amongst many different classes. For example…
If we have five different CWE classes we are classifying across, a block which has been seen before in all five CWE classes might return a probability from naive Bayes something like this:
Class 1: 20%
Class 2: 23%
Class 3: 21%
Class 4: 19%
Class 5: 17%
On the other hand, a basic block that has only been seen before in one category might return a distribution like this:
Class 1: 2%
Class 2: 3%
Class 3: 93%
Class 4: 1%
Class 5: 1%
It’s worth noting that while I say “a basic block that has been seen…”, in reality any basic block that is similar-ish to a basic block that’s been seen before, i.e. differs in handful of features, will be classified in the same way. That’s the power of machine learning — we train our classifier to recognize things it’s never seen before, using data that is hopefully representative of the problem space.
So now that we understand how the classifier is being used, let’s give it a go!
Trial 1: Start Simple
For the first attempt, I kept everything as simple as possible. I ignored all of the clever stuff I mentioned about using probabilities to classify blocks as significant or not. While I had intuition that those things would be important, it’s important to challenge and validate your assumptions before acting on them. So for this trial, I randomized over the entire dataset, not bothering to keep samples from the same binary together, and I simply had my classifier predict the CWEs it thought each block had.
This did not go well.
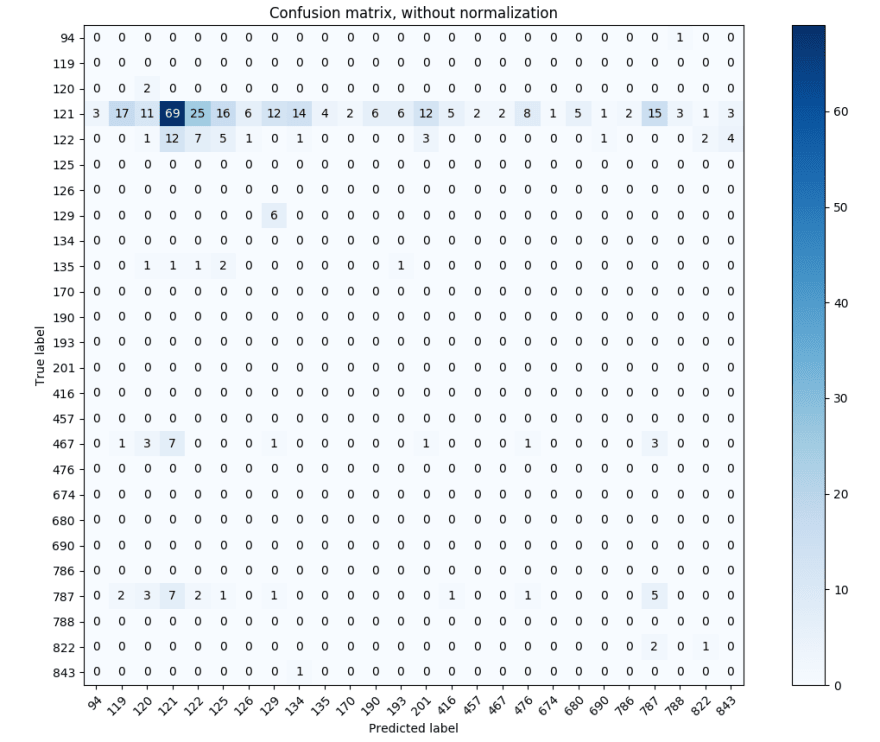
I mean it could have gone worse. My classifier achieved a ~25% accuracy, predicting across 27 CWE classes. I plotted a confusion matrix, so I could see if it was doing anything shady, like only classifying samples as class 121 or 122 (because if you recall, those are the classes that the data was skewed toward).

The errors are all over the place. Most classes do get misclassified as 121 more often than others, but not overly so. The fact that the errors are so spread out across the different classes is encouraging, because it may indicate that my approach has credence. It’s possible that the basic blocks that are getting misclassified are pretty common across most classes, and therefore get misclassified as any of them.
To figure out if this was true, I took a look at the probabilities that were generated during classification. I wanted to get a general sense of what the probability spread looked like, so I calculated some basic stats.
Highest probability ever seen: 0.9560759838758044
Lowest probabilities ever seen: 2.4691830828330134e-09
Average difference between in-sample highest and lowest probabilities: 0.32504693947187246
Standard deviation of in-sample probability differences: 0.06998244753425269
Hm. It seems like on average, the classifier is pretty confident about what it’s classifying. But the average could be skewed by it being confident classifying the blocks with vulnerabilities, and far less confident in the others. If that were the case, I’d expect to see the bi-modal distribution of the in-sample probability differences. So, let’s plot it.

That could somewhat be considered a bi-modal distribution. Not quite the separation that I would have hoped between the two modes, but there is certainly a second spike in the graph. You’ll notice that our average sits right in between the two spikes, at around 0.3.
At this point, I still have no idea if the data points that have a higher probability difference actually classify better than the ones that do not. There’s one easy way to find out, though — try it. I wrote some code to drop classified blocks that had an in-sample probability difference of less than 0.4, and then looked at the results.
Trial 2: Probability Inspection
Correctly identified 90/347
Accuracy: 0.259365994236
Not terribly convincing. Let’s try upping the threshold to 0.45.
Correctly identified 42/137
Accuracy: 0.306569343066
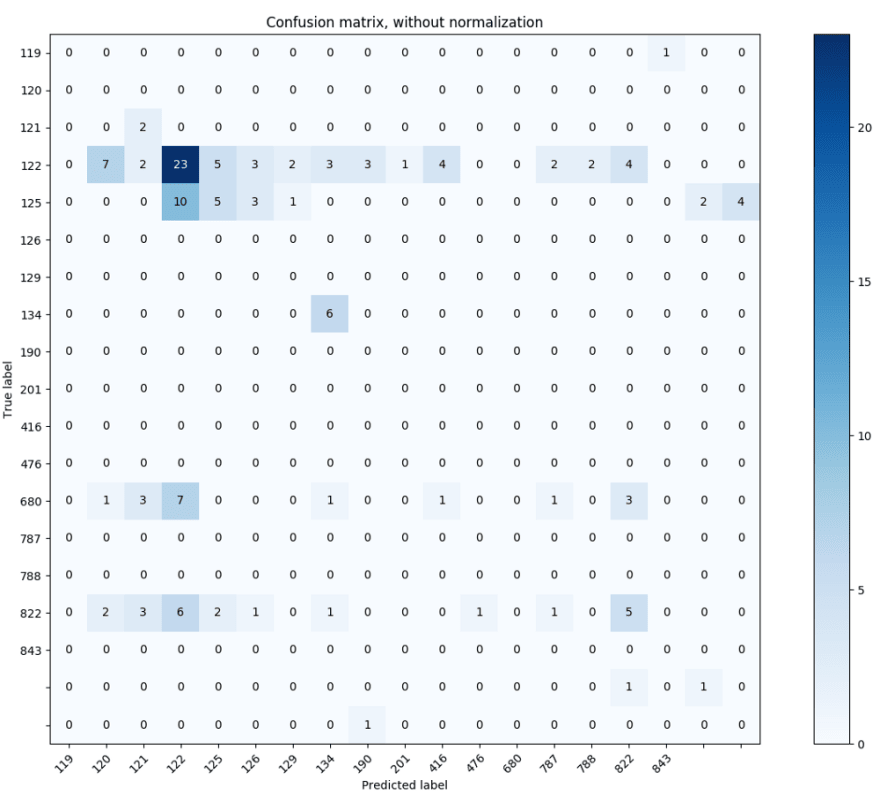
Accuracy is increasing, but not by as much as I’d like. And the confusion matrices still have the same general spread. It honestly doesn’t look much at all like the difference between the highest and lowest probability in a prediction is correlated at all with the accuracy of the classifier. I gave it another run at 0.5.
Correctly identified 17/67
Accuracy: 0.253731343284

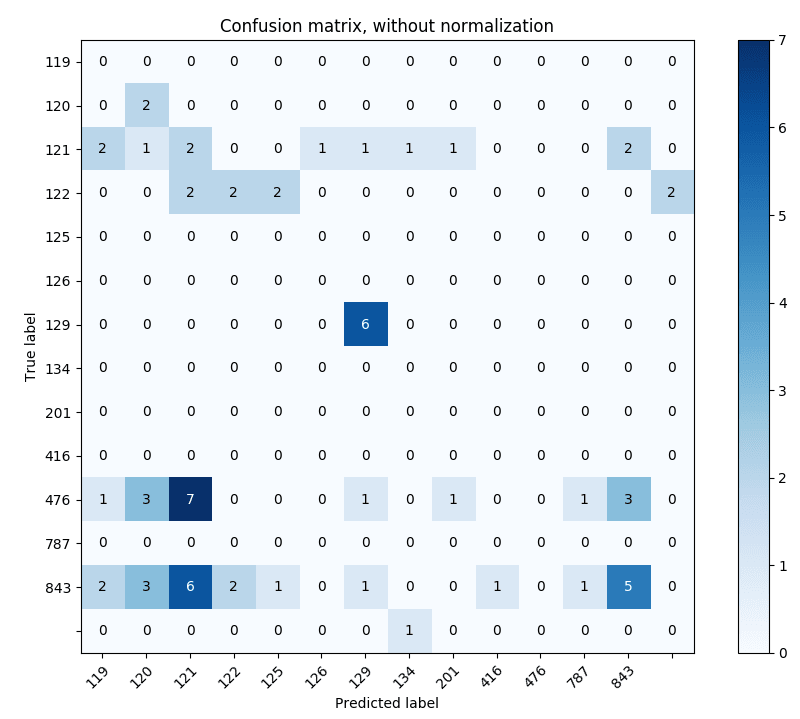
…and the accuracy went down. I’m willing to believe that it’s just not going to have an effect.
It’s time to take stock of where we are and reform an approach. It appears that my approach utilizing the predicted probabilities to weed out uninformative basic blocks may not work, however I would like to try not splitting binaries across training and testing data to eliminate the possibility that this is preventing the classifier from learning what common basic blocks are. It seems unlikely, but it’s possible. It’s also possible that our data needs better labeling to be useful — this will take time, time that I don’t believe I have for this project. We can re-featurize the data to include counts of the number of times an instruction occurred in the basic block, rather than just whether or not it occurred. This will give the classifier more information to work with, which may improve its accuracy.
Next up: part 3


Latest comments (0)