We are going to learn how to use the Sidecar Container pattern to install Logstash and FluentD on Kubernetes for log aggregation.
For any system, log aggregation is very important. When you use Kubernetes to run your application, the log only belongs to one Pod. If that Pod is deleted, the log is also lost.
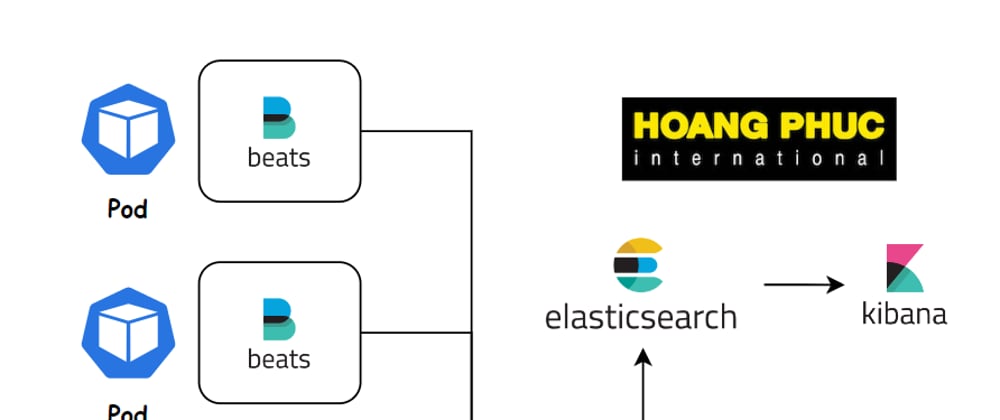
Therefore, if we want to track system failures, we must have a log aggregation system. At this time, two popular log stacks are ELK (Elasticsearch Logstash Kibana) and EFK (Elasticsearch FluentD Kibana).
To collect logs on each Pod, we use Sidecar Container.
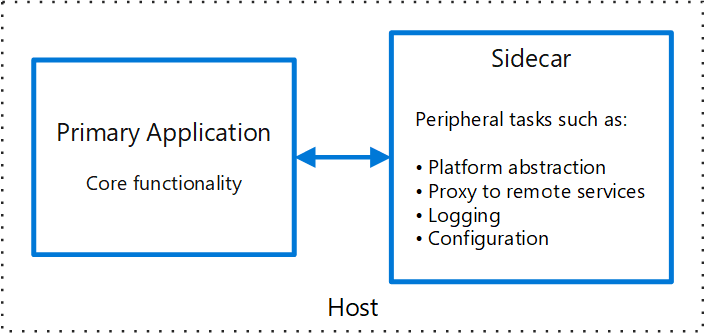
Sidecar Container
Instead of implementing the log collection process on the application containers, we can separate that process to another container to avoid affecting the performance of the application containers. That container is called Sidecar Container.
Sidecar containers are the containers that should run along with the main container in the pod. This sidecar container extends and enhances the application containers in some way.
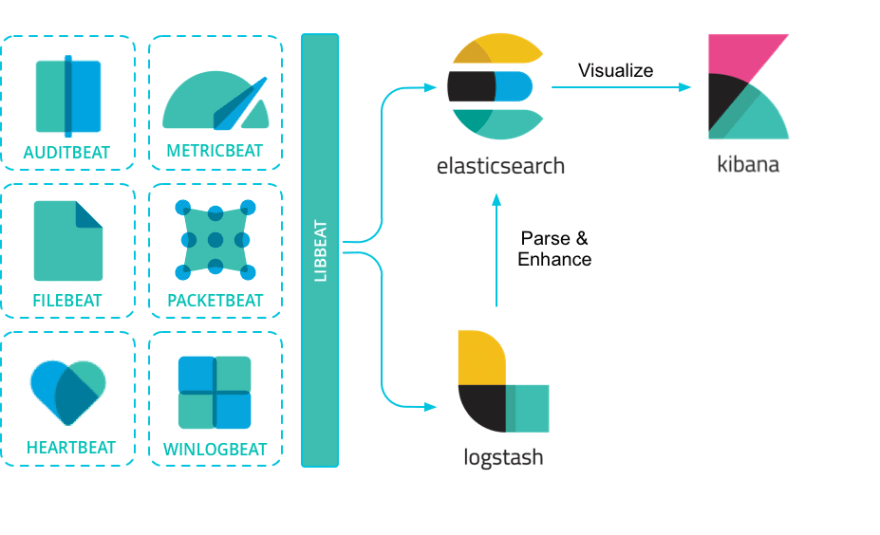
Logging with Logstash
The original task of Logstash is monitoring logs and transforming them into a meaningful set of fields and eventually streaming the output to a defined destination. However, it has an issue with performance.
So, Elastic has launched Filebeat that use for monitoring logs and streaming the output to a defined destination.
And Logstash acts as an aggregator that ingests data from a multitude of sources, transforms it, and then sends it to your favorite “stash.”
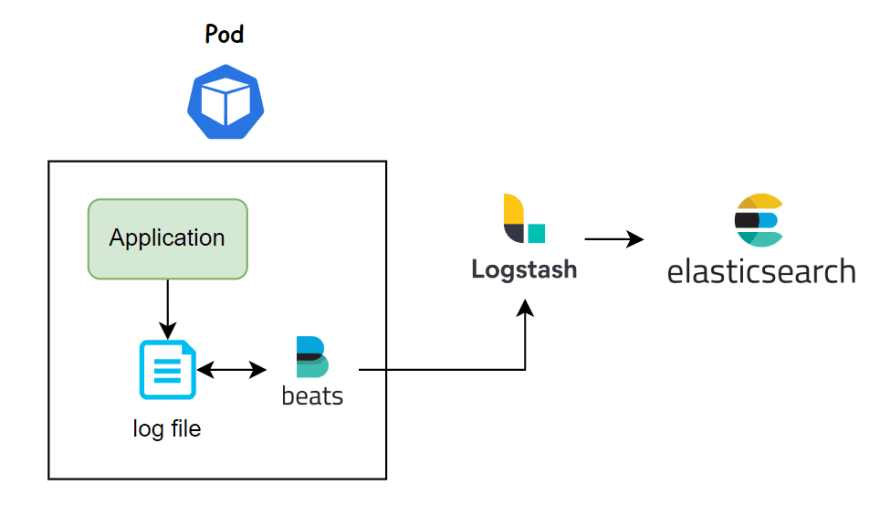
So we’re done with the theory, let’s get to work. First we deploy a Pod with an application container that writes logs to the file /var/log/access.log, and we deploy a sidecar container on the same Pod that runs Filebeat to collect logs and output logs to Logstash.
Create a file named filebeat.cm.yaml to store the Filebeat configuration file.
apiVersion: v1
kind: ConfigMap
metadata:
  name: filebeat-config
  labels:
    component: filebeat
data:
  conf.yaml: |
    filebeat.inputs:
    - type: log
      paths:
        - '/var/log/*.log'
    output:
      logstash:
        hosts: [ "logstash:5044" ]
The input of Filebeat we read from files /var/log/*.log, then we output these logs to Logstash.
Create a file named application.yaml.
apiVersion: apps/v1
kind: Deployment
metadata:
  name: busybox
  labels:
    component: busybox
spec:
  strategy:
    type: Recreate
  selector:
    matchLabels:
      component: busybox
  template:
    metadata:
      labels:
        component: busybox
    spec:
      containers:
        - name: busybox
          image: busybox
          args:
            - sh
            - -c
            - >
              while true;
              do
                echo $(date) - filebeat log >> /var/log/access.log;
                sleep 10;
              done
          volumeMounts:
            - name: log
              mountPath: /var/log
        - name: filebeat
          image: elastic/filebeat:7.16.3
          args:
            - -c
            - /etc/filebeat/conf.yaml
            - -e
          volumeMounts:
            - name: filebeat-config
              mountPath: /etc/filebeat
            - name: log
              mountPath: /var/log
      volumes:
        - name: log
          emptyDir: {}
        - name: filebeat-config
          configMap:
            name: filebeat-config
In the Pod above we mount the Filebeat configuration file into the /etc/filebeat/conf.yaml file and use the args to specify that configuration file for Filebeat.
Our application container writes a log to the file /var/log/access.log every 10s. We use emptyDir volumes to share storage between two containers.
Next, we create a file named logstash.cm.yaml to store the Logstash configuration file.
apiVersion: v1
kind: ConfigMap
metadata:
  name: logstash
  labels:
    component: logstash
data:
  access-log.conf: |
    input {
      beats {
        port => "5044"
      }
    }
    output {
      elasticsearch {
        hosts => [ "elasticsearch:9200" ]
      }
    }
Create a Logstash Deployment file named logstash.yaml.
apiVersion: apps/v1
kind: Deployment
metadata:
  name: logstash
  labels:
    component: logstash
spec:
  strategy:
    type: Recreate
  selector:
    matchLabels:
      component: logstash
  template:
    metadata:
      labels:
        component: logstash
    spec:
      containers:
        - name: logstash
          image: logstash:7.16.3
          ports:
            - containerPort: 5044
          volumeMounts:
            - name: logstash-config
              mountPath: /usr/share/logstash/pipeline
      volumes:
        - name: logstash-config
          configMap:
            name: logstash
---
apiVersion: v1
kind: Service
metadata:
  name: logstash
  labels:
    component: logstash
spec:
  ports:
  - port: 5044
  selector:
    component: logstash
We mount the configuration file to the folder /usr/share/logstash/pipeline, Logstash will load the configuration files from this folder.
Create Elastichsearch (just for test).
apiVersion: apps/v1
kind: Deployment
metadata:
  name: elasticsearch
  labels:
    component: elasticsearch
spec:
  strategy:
    type: Recreate
  selector:
    matchLabels:
      component: elasticsearch
  template:
    metadata:
      labels:
        component: elasticsearch
    spec:
      containers:
        - name: elasticsearch
          image: elasticsearch:7.16.3
          ports:
            - containerPort: 9200
              name: client
            - containerPort: 9300
              name: nodes
          env:
            - name: JAVA_TOOL_OPTIONS
              value: -Xmx256m -Xms256m
            - name: discovery.type
              value: single-node
          resources:
            requests:
              memory: 500Mi
              cpu: 0.5
            limits:
              memory: 500Mi
              cpu: 0.5
---
apiVersion: v1
kind: Service
metadata:
  name: elasticsearch
  labels:
    component: elasticsearch
spec:
  ports:
  - port: 9200
    name: client
  - port: 9300
    name: nodes
  selector:
    component: elasticsearch
Kibana.
apiVersion: apps/v1
kind: Deployment
metadata:
  name: kibana
  labels:
    component: kibana
spec:
  strategy:
    type: Recreate
  selector:
    matchLabels:
      component: kibana
  template:
    metadata:
      labels:
        component: kibana
    spec:
      containers:
        - name: kibana
          image: kibana:7.16.3
          ports:
            - containerPort: 5601
---
apiVersion: v1
kind: Service
metadata:
  name: kibana
  labels:
    component: kibana
spec:
  ports:
  - port: 5601
  selector:
    component: kibana
Run apply command to create resources.
kubectl apply -f . --recursive
Use port-forward to access Kibana Dashboard.
kubectl port-forward svc/kibana 5601:5601
Now, go to menu Stack Management > Index patterns and create an index pattern, then go to menu Discover and you’ll see the logs we collected from the busybox container.
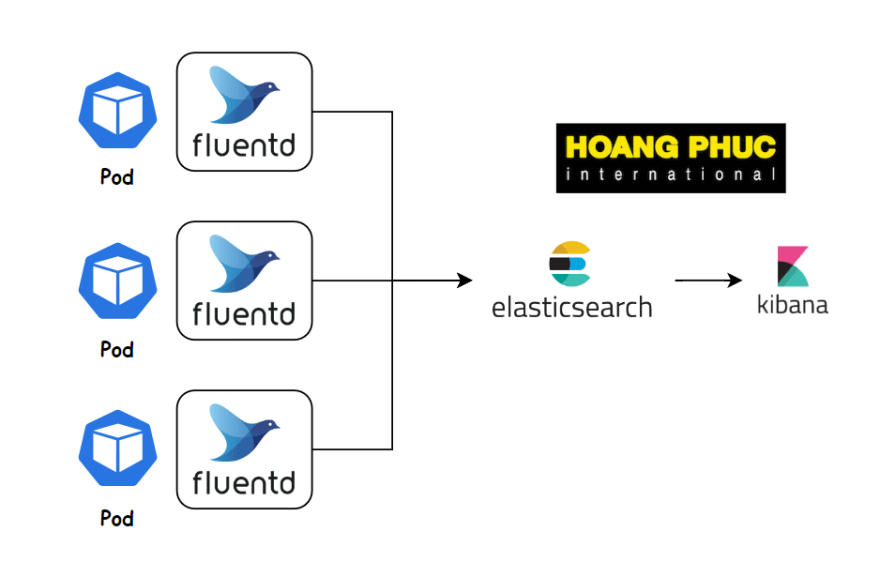
Logging with FluentD
FluentD is also a log collection tool like Filebeat and Logstash. It is an open-source data collector, which lets you unify the data collection and consumption for better use and understanding of data.

We can use it as Sidecar Container to collect logs from a Pod.
Create a file named fluentd.cm.yaml to store the Filebeat configuration file.
apiVersion: v1
kind: ConfigMap
metadata:
  name: fluentd-config
  labels:
    component: fluentd
data:
  fluent.conf: |
    <source>
      @type tail
      path /var/log/access.log
      pos_file /tmp/app.logs.pos
      tag app.logs
      <parse>
        @type none
      </parse>
    </source>
    <match app.logs>
      @type elasticsearch
      host elasticsearch
      port 9200
      logstash_format true
      logstash_prefix fluentd
      flush_interval 1s
    </match>
we use the <source> tag to specify where we should collect the logs, then we use the <match> tag to output the log to Elasticsearch.
Next, create a file named application.yaml.
apiVersion: apps/v1
kind: Deployment
metadata:
  name: busybox
  labels:
    component: busybox
spec:
  strategy:
    type: Recreate
  selector:
    matchLabels:
      component: busybox
  template:
    metadata:
      labels:
        component: busybox
    spec:
      containers:
        - name: busybox
          image: busybox
          args:
            - sh
            - -c
            - >
              while true;
              do
                echo $(date) - filebeat log >> /var/log/access.log;
                sleep 10;
              done
          volumeMounts:
            - name: log
              mountPath: /var/log
        - name: fluentd
          image: govtechsg/fluentd-elasticsearch
          volumeMounts:
            - name: fluentd-config
              mountPath: /fluentd/etc
            - name: log
              mountPath: /var/log
      volumes:
        - name: log
          emptyDir: {}
        - name: fluentd-config
          configMap:
            name: fluentd-config
Run apply command to create resources.
kubectl apply -f . --recursive
Fluentd Plugin
It is important to note that in order to output logs to Elasticsearch, we must use the Fluentd Elasticsearch Plugin.
As you can see above we are using the govtechsg/fluentd-elasticsearch container, this container already has the Elasticsearch Plugin.
If you use the fluent/fluentd container, it will give an error that cannot be found @type elasticsearch.
To install the plugin, we can write Dockerfile as follows.
FROM fluent/fluentd:v1.12.0-debian-1.0
USER root
RUN gem install fluent-plugin-elasticsearch --version 5.0.3
USER fluent
Full list of FluentD Plugins https://www.fluentd.org/plugins/all.
Real-world Use Case
Continuing at Medium
Conclusion
So we have learned how to use the Sidecar Container pattern to set up log collection for Pod. ELK and EFK are two very popular log stacks. If you have any questions or need more clarification, you can ask in the comment section below.


Oldest comments (0)