
If you have a bunch of microservices up and running, aggregating all the application logs in a single log management solution is a must. Depending on how you deploy your applications, where you deploy your applications, there are plenty of tools and solutions out there to achieve this. But, picking the right combination of tools is crucial because you’ll have enough maintenance work on your application infrastructure rather than reimplementing your log aggregation scheme time-to-time when it goes haywire. In this article, I’m going to explain setting up such a great combination of tools for Node.js based microservices.
This is the first article of a series focused on building a Microservice architecture with NodeJS. You can access the rest of the articles on the series below:
- Bunyan JSON Logs with Fluentd and Graylog (This article)
- Error Management in Node.js Applications
- Implementing Event Sourcing and CQRS pattern with MongoDB
- Canary Health Check Endpoints (Coming Soon)
- Writing MongoDB Database Migrations with Node.js (Coming Soon)
In this article, we will discuss how to implement a log aggregation mechanism for a set of Node.js microservices running on Docker. To simplify things, I’ll consider everything runs as a Docker container in order to explain things, but certainly, you can implement the same scheme even if you run everything on bare metal.
We’ll use
- Bunyan as our standard logging library for our Node.js apps
- GrayLog as the log management and visualization server where all our logs can be viewed and analyzed
- Fluentd as the intermediate log collector who’ll gather all the logs from our apps and push to GrayLog
Our Approach
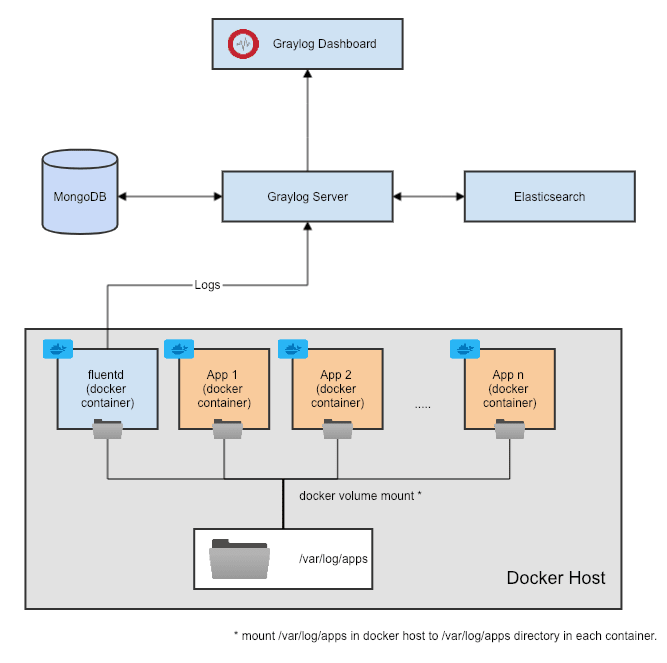
We’ll run each of our NodeJS microservice as a separate docker container. And we’ll run Fluentd as a separate container on the same docker host.
Now we need a way to share application logs with Fluentd so that it can send it to GrayLog. This can be done in multiple ways:
- Using Fluentd docker log driver — There are multiple limitations of this approach, and also some serious issues when it’s on the play. You can read more about here.
- Running Fluentd inside each application container itself — This is a viable approach. One concern of this is, your application docker containers will be bundled with an extra dependency. If you need to upgrade Fluentd to the latest version, you have to update the application docker image itself and re-deploy all of your applications.
- Running Fluentd as a separate container, allow access to the logs via a shared mounted volume — In this approach, you can mount a directory on your docker host server onto each container as a volume and write logs into that directory. You can then mount the same directory onto Fluentd and allow Fluentd to read log files from that directory. This approach separates log aggregator from your application containers, but it could make Fluentd a single point of failure. For log aggregation, this is not usually a critical problem as Fluentd has the ability to continue collecting logs from the last position if it goes down and comes up.
There are also other ways to do this besides the above and you can choose any of these approaches depending on how you want it to be. But for the purpose of this article, let’s use the 3rd approach as the above diagram depicts.
Let’s now look at logging.
Log libraries for Node.js Apps
Talking about logging, there are so many excellent logging libraries available for Node.js applications. Some of the most commonly used ones are Bunyan, Winston, Log4js, Pino and blah blah blah. For a long time, I’ve been sticking to Bunyan, just because it’s simple to use, does the work perfectly and I’m lazy to move to something else.
An annoying feature I saw during the first days of using Bunyan was, it logs in JSON format. Bunyan JSON log was not something eye-friendly at all. If you needed to display it in a pretty format, you had to pipe it through bunyan binary.


But sooner I realized there are a couple of good things about it especially when it comes to log aggregation. Let’s say: what if we write our Bunyan log in this prettified format, and decide to push it to Graylog.
You can still do it by consuming the logs via fluentd, tokenizing each log line using a named regular expression such as the following, and then sending it to Graylog.
\[(?\<timestamp\>\d{4}-\d{2}-\d{2}T\d{2}:\d{2}:\d{2}\.\d{3}Z)\] (?\<level\>[A-Z]+): (?\<name\>.+)\/(?\<processId\>\d+) on (?\<hostname\>.+): (?\<message\>.+)
But this approach has two disadvantages.
What if you decide to add a new field to the Bunyan log record?
If you have used Bunyan, you’d know that this is possible as long as the new property name does not clash with the default fields such as name, level, hostname, etc. Every time you add a new field, your log lines will be different than before and your old regular expression won’t be able to recognize it. Then you’ll have to re-deploy Fluentd with the updated regular expression to recognize the new field.
What if your application’s log contains dynamically added fields?
If you see in the prettified log above, there are some log lines ending with an optional (workerId=<someId>). This is because the above log is from a clusterized NodeJS application and whenever a worker process dumps a log, it adds an additional field to the JSON logline with the key workerId using log.child() in Bunyan.
This is a really helpful feature in Bunyan called child logs, where different modules from your application can add an additional property to the log message to identify that the particular log was generated from the same module.
If your application adds such dynamic fields to the log lines, it could be cumbersome to write a named regular expression which is capable of parsing all dynamic fields from the log lines to produce a unified tokenized output.
The advantage of JSON logs
But, if you write your logs in default JSON format, it’ll still be a good ol’ JSON even if you add new fields to it and above all, FluentD is capable of parsing logs as JSON. This is really cool because the newly added fields or dynamically added fields will immediately be available in GrayLog for analysis without any additional configuration anywhere.
To do that we need to,
- Write our logs in JSON format using Bunyan (or any other logger who logs as JSON),
- Read logs from fluent and parse each line as JSON,
- Convert parsed JSON data to Graylog GELF format (which Graylog understands) and publish to Graylog.
Seems easy.
Configuring Fluentd
Now, we need to prepare Fluentd to parse logs as JSON and push them to Graylog in GELF format. To do this, we need to configure Fluentd so.
However, this exact functionality we need from Fluentd doesn’t come out-of-the-box. Fluentd requires a special plugin to publish logs in GELF format. We’ll use the following Fluentd plugin for this purpose:
 emsearcy
/
fluent-plugin-gelf
emsearcy
/
fluent-plugin-gelf
Buffered fluentd output plugin to GELF (Graylog2)
fluent-plugin-gelf
However, due to a minor caveat, I would not use this plugin as is. So I forked it, did some minor changes to its code and used it for my purpose. I’ll explain why I had to do so until then, we are continuing here onwards using my version of it, which is the following:
Now, we are going to build our own custom Fluentd docker image using the base docker image. We’ll bundle the above plugin and our Fluentd configuration into our custom image. Let’s use the following docker file for our image:
Download the dockerfile into a directory on your local machine. To build the image from this dockerfile, we need our Fluentd GELF plugin (out_gelf.rb) and Fluentd config (fluentd.conf)
Then go to the above plugin repository, and find the Fluentd GELF plugin located here named out_gelf.rb. Download it, and copy it to the same directory as the dockerfile.
Next, we need the following Fluentd configuration (fluentd.conf) where we configure out input sources (application logs).
Download it to the same directory as the dockerfile and change your docker host and GELF UDP input port accordingly (If you choose TCP, you might need some additional configurations). In the same config, your additional log sources can be specified surrounded by <source> blocks.
@type gelf in the <store> block instructs Fluentd to use our GELF plugin in order to push the logs to GrayLog.
Let’s now build custom docker container.
docker built -t myfluentd .
Then, run the container and mount the host /var/log/apps/ directory onto the Fluentd container.
docker run -v /var/log/apps:/var/log/apps -d myfluentd
Fluentd container should now have access to the application logs as you configured in fluentd.conf. If your connectivity between Fluentd and Graylog is working, Graylog should now display your logs in the dashboard like a charm!!

One last word
If you remember, I said that I could not use the Fluentd GELF plugin as-is. The reason was, the level field in Bunyan log is not compatible with the standard syslog level codes which the Fluentd GELF plugin understands. So, I had to make some changes in the plugin’s ruby script to get it working properly. As you can see in the above image. Bunyan level is now displayed in GrayLog as the field level_code.
You can use the following docker-compose file in order to quickly setup GrayLog, ElasticSearch, MongoDB and Fluentd in your machine in order to test locally (Make sure you set the image names correct).
Please feel free to put any comments if you have any questions or suggestions to do this better. Thank you.


Oldest comments (0)