
In this article, we'll be looking into four different methods of how to debug AWS Lambda functions faster.
Great writers use metaphors to get their point across, so let me give that a try real quick.
Bugs are nasty little pests. It's hard to get rid of them, but apart from just spraying poison everywhere, there are only a few options left. One of those options is using a natural predator to get rid of those bugs, a predator like birds.
So birds can help you get rid of bugs, and I work for a company called Dashbird that helps developers debug their AWS Lambda applications.
See what I did there? Pests\bugs ⇔ birds\Dashbirds?
Main Reasons For Using AWS Lambda Functions
One of the main AWS Lambda perks is that, as AWS claim, "You can forget all about the project's infrastructure and focus solely on launching apps in the cloud while you'll be able to perform integrations with other Amazon services." Scalability and the low cost of using the AWS computing resources are other perks that come along.
 Anatomy of a Lambda function - AWS re:Invent 2017
All you need to do is to write your function, connect it to an event, deploy it, and AWS will take care of the rest. The Lambda function will process thousands of requests every hour on AWS with no need for your effort whatsoever.
But what happens when a Lambda function fails?
How To Debug AWS Lambda Functions?
When talking about the debugging process on AWS Lambda functions, four methods are most commonly used. These methods can be grouped into two categories. The first one is offline debugging, and the second one logging.
Debugging Lambda Functions Offline
Offline debugging allows you to work locally in case of a standard development process.
The Serverless Offline library is great for debugging your application while it's still in development. It acts very similar to AWS, giving you access to various services like SQS, SNS, S3, etc., only, instead of the request hitting the live services, it goes to a local emulated service.
Logging Lambda Functions Online
Suppose you have a live service or have a dev/staging environment or multiple developers working on the same project at once. In that case, you'll need to start looking at live debugging services. While there are tons of tools to debug monolith applications, for serverless specifically, there are only a few tools for debugging, some better than others.
But when you deploy your Lambda function to real infrastructure, logging might be the only debug method left. Logging can be done in three ways.
- First, log directly to AWS CloudWatch, by simply writing to standard out. This is probably the most popular method because it's easy to set up. The downsides of CloudWatch are that all the logs are grouped, and it can take a lot of time to figure out what's wrong when you have many moving parts in your app. Nevertheless, it's probably the best option if you are just starting with AWS Lambda.
- The second way is to write your own logging tool with AWS services like Kinesis. In this process, the need for manually creating these tools will take developers a lot of time, which further means it'll cost more since additional Amazon infrastructure will be used. But at first, this process seems quite faster.
- The third way is the use of third-party logging services. They don't have the downsides of using CloudWatch but also don't require you to waste development time.
Dashbird is the only tool entirely dedicated to monitoring and debugging AWS Lambda applications and serverless systems, and the main reason our users love the service is its simplicity. With just a few clicks you can connect your AWS account, no code changes, and start discovering and troubleshooting unknown and known errors from general statistics of your microservices to individual function execution profiles.

Debugging AWS Lambda Functions with Dashbird
Dashbird is an excellent choice since it was built especially for serverless developers, and it's able to detect quickly any sorts of failures. Dashbird offers quite a lot of features for effective debugging like:
- Error Views necessary in showing and discovering the point of failure that gives developers insight into what went wrong.
- Log Search allows you to search through Lambda logs, which means you'll be able to find relevant invocations.
- Function View allows you to look closer into any function that seems to misbehave and thoroughly work on it.
- Live Tailing allows developers to perform a real-time observation of a function's activity.
- Tracing gives you an incredible and compelling insight into what your invocations are doing and how they're interconnected.

Debugging an Example Lambda Function
Let's try to debug an example function. We can create one with the AWS Lambda web console. I'll assume that you know how to do this and just give you the example code here:
exports.handler = async (event, context) => {
console.log("Logging!");
const x = event.a.b;
};
Two types of logs will be produced by this function. First the call to the console.log function then the access of an undefined event property.
If you open up Dashbird, the first thing you will see is the main dashboard. This error will be in plain sight.

"Cannot read property 'b' of undefined" --- a well-known JavaScript error message. When you click on it, you get the event view with more details of the error.

Dashbird's error details will show you when the error first happened, when it last happened, where it happened and how severe it actually is.
It even gives you a stack trace, which helps to debug the error before the next deployment.
But where did the call to console.log end up? If you go to Inventory and click on your Lambda function in the list that opens you can choose from the last invocations of that function. My function is called extractRecords so that's what I'll search for.
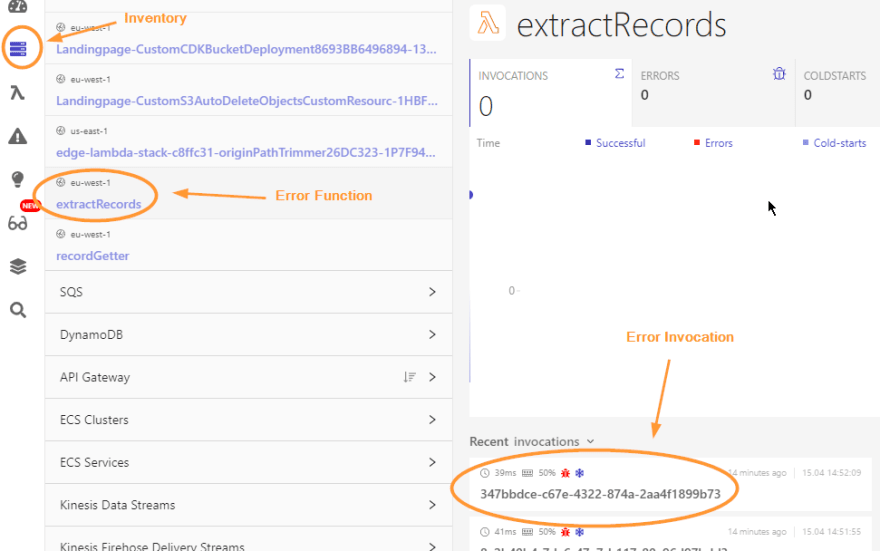
If I click on the last invocation, the logs of that invocation will open and I'll see the log call and the error.

Depending on the number of logs you write in your function, it can become hard to find the error, that's why I'd recommend using the error details when debugging.
Summary
AWS Lambda functions are working in an isolated remote environment, which complicates debugging more and more. While your code is in the development phase, it's still crucial to go through frameworks (think Serverless Application Model) to monitor and debug your code on your machine.
When you finally deploy your function to the cloud, different methods are required to get the insights you need. If you think CloudWatch is too clunky and you want to see what's happening at one glance, give Dashbird a try. It's built from the ground up to monitor serverless applications and removes many obstacles you would find when building your own logging service.


Top comments (0)