Every new major release of Chrome, I check the release notes, and this time I got super excited to see "Recorder" being added.
This feature can be used to record, replay and measure user flows! End-to-end testing in the browser.
Doesn't that sound amazing? 👏
Finding the Chrome DevTools Recorder
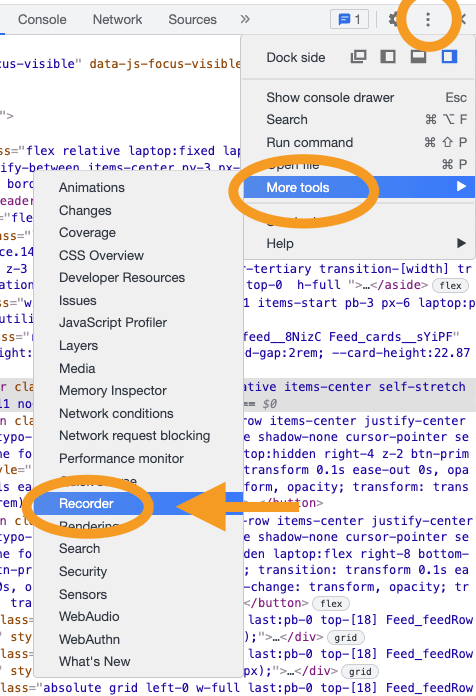
To find the recorder, you first open up the Chrome DevTools.
Mac
Cmd+Shift+Cor Windows:Ctrl+Shift+C.
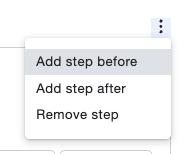
Then you can click on the "More options" button, find the "Mote tools" dropdown, and search for "Recorder".
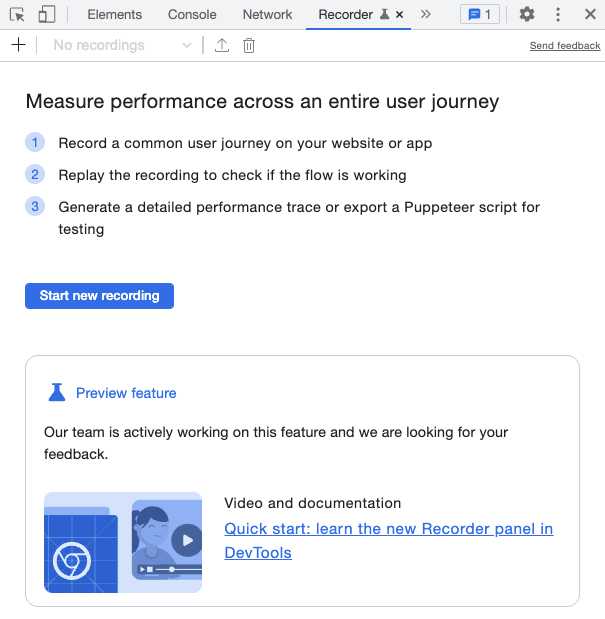
Once you open the recorder, it will have some details on how it works.
So basically, we can define user flows that we can re-test over time. This is great for testing essential flows in the application.
And more importantly, measure if they did not deprecate performance in new versions.
I'll be using daily.dev as my guinea pig for testing user flows.
I will be testing the flow of switching between feeds, adjusting the feed settings, and clicking an article, after which we can upvote it.
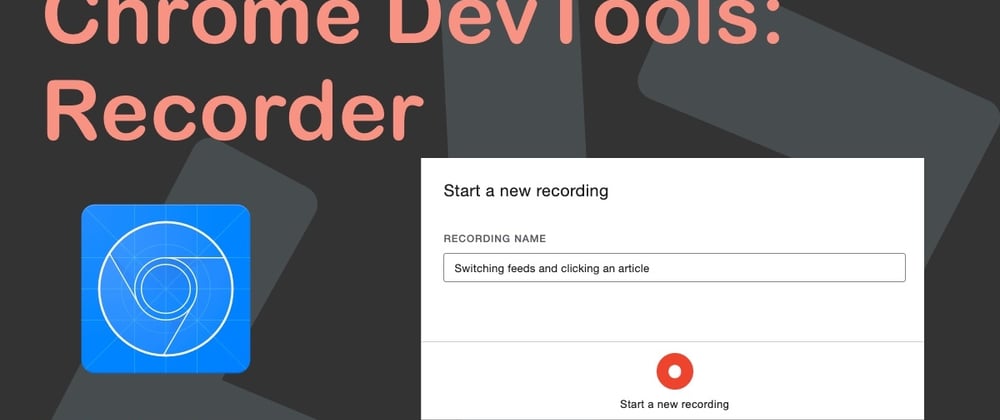
In the recorder panel, click the "Start new recording" button.
It will ask you to give the recording a new name, and at the bottom, there is a big red button to start recording.

Once you hit the record button, you can click the elements you want.
And once you are done, hit the "End recording" button at the bottom of the recorder panel.

Once you are done, you should see your actions in a neat overview.

From here, you will be able to "Replay" the recording.
This will look through each step to see if the flow still works. Remember, this recording will stay here so you can test it over time.
Another thing we can do here is to click the "Measure performance" button.
This will loop through the flow you defined and measure that specific recording as you might have seen before in the "Performance" tab.
I find it amazing that we now have a browser way of testing user flows and even measuring those specific flows over time.
Bonus things
We can now do some cool bonus things with this recorder panel.
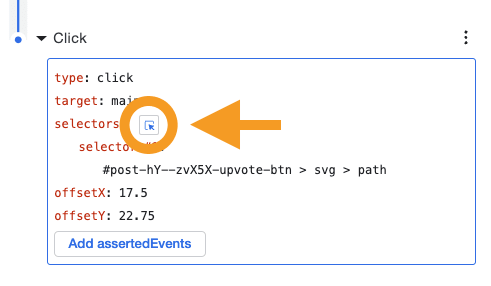
First, we can manually change selectors by using the little select icon for each event.
The next thing we can manually add specific events to our workflow.
Another thing we can do is define a throttle setting for the replay, which is excellent if you want to test out slow connections, for instance.

And last but not least, we can export a recording. This will generate a Puppeteer script you can further modify and use.

Let me know what you think of this new feature.
Thank you for reading, and let's connect!
Thank you for reading my blog. Feel free to subscribe to my email newsletter and connect on Facebook or Twitter


Top comments (10)
I wanna some more details regarding this process. I hope that you will provide to us as soon as possible.
On what part would you like more details?
After recording the step as we performed on the test case at that time.
Suppose that I am testing a function components button that is working or not and I am performing the steps and recorder record the steps and click on end button and test case have recorded and on that time when I try to check steps and click on reply button but on that time recorder have not played the video as it has recorded. So, On that point, I have to need more details. Thank you.
I hope That you will understand my problem where I am stacked on this problem And I hope that you will provide me with support as soon as possible that I can resolve this problem. Thank You so much, Sir.
Hey there.
So basically the replay is not working for you?
It might be a bug and best to log it with the Chrome DevTools team here:
bugs.chromium.org/p/chromium/issue...
When they announced this I was blown away!
One trick I found is to fire this up with CPU throttling on, then try a user process and see where unexpected hiccups occur.
Also really useful for CLS issues that occur after page load or on sites with transitions!
That's a neat trick!
Ah great tip indeed!
I did indeed try that and gives you a really good view on where things freeze up.
I also noticed it a few days ago.
It was a pleasant surprise.
But it sure feels like a first version.
The good parts:
The not-so-good parts:
My two cents:
If you're working on a weekend project, it's a decent way to test if it's working correctly in Chrome.
As for testing complex flows, it's not going to cut it.
Disclaimer:
As someone working at Endtest, I know that a useful test automation tool needs a lot more than a record and playback feature.
Totally is a beta feature for now, but pretty sure Chrome will make it better over time.
Technically you could get a screencap artifact from the performance tab.
And when running puppeteer include that as in the CI/CD.
But get your points, as this is very limited and more a workaround than it could be.
Let's hope they keep improving this.