How to draw 3 lines in a chart using Pine language from tradingview:
//@version=4
study("Line", overlay=true)
L = line.new(bar_index, high, bar_index[10], low[10], width = 2)
line.delete(L[1])
M = line.new(bar_index, high, bar_index[30], low[30], width = 2)
line.delete(M[1])
N = line.new(bar_index, high, bar_index[60], low[60], width = 2)
line.delete(N[1])
line.set_color(L,color=color.green)  // la linea mas corta
line.set_color(M,color=color.red)   // la mediana
line.set_color(N,color=color.blue)  // la linea mas larga
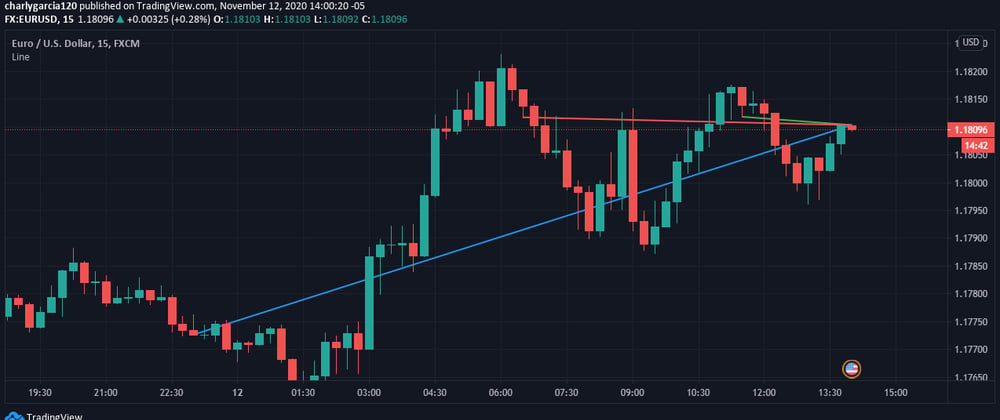
The result is like in the next graph:

Explanation:
The shortest line is green (10 candles)
The medium line is red (30 candles)
The largest line is blue(60 candles)
How to Use ?
You need to identify the slope of every line and the respective moment or the value of the trend in a forex instrument graph.
And using the slope you can program more complex algorithms, to make decisions about buy or sell.
Use this code in your programs and let us to know.
Thanks for read


Top comments (0)