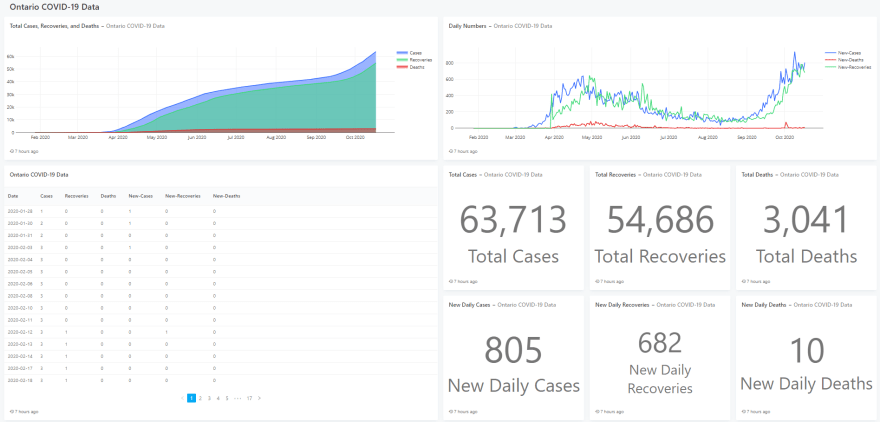
Hey dev.to! Excited to share another project I've been working on. I present to you my Dashboard for COVID-19 data for Ontario Canada! I created an automated ETL pipeline using Python on AWS infrastructure and displayed it using Redash.
Project Overview
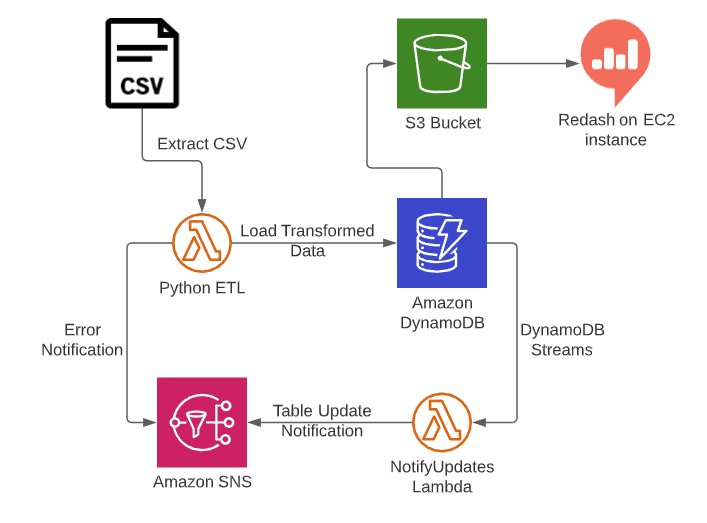
The idea of this project came from A Cloud Guru's monthly #CloudGuruChallenge. For September the goal was to build an automated pipeline using python that would extract csv data from an online source, transform the data by converting some strings into integers, and load the data into a DynamoDB table. After that we would display the data in a dashboard. I added a little twist to this to make it more relevant to me and used data for Ontario Canada instead!
I was excited to work on this project because I wanted to develop my Python coding skills and also create a useful tool that I can use everyday and share it with others if they're interested!
Discovering Trello
Over the last 3 months I've learned that free time is very valuable and often in short supply so I needed a way to organize my workload and maximize efficiency. I started looking around for some tools that could help in this aspect and started from JIRA which I use at work. Unfortunately JIRA seemed a bit overkill for just a one person team which is when I discovered Trello.
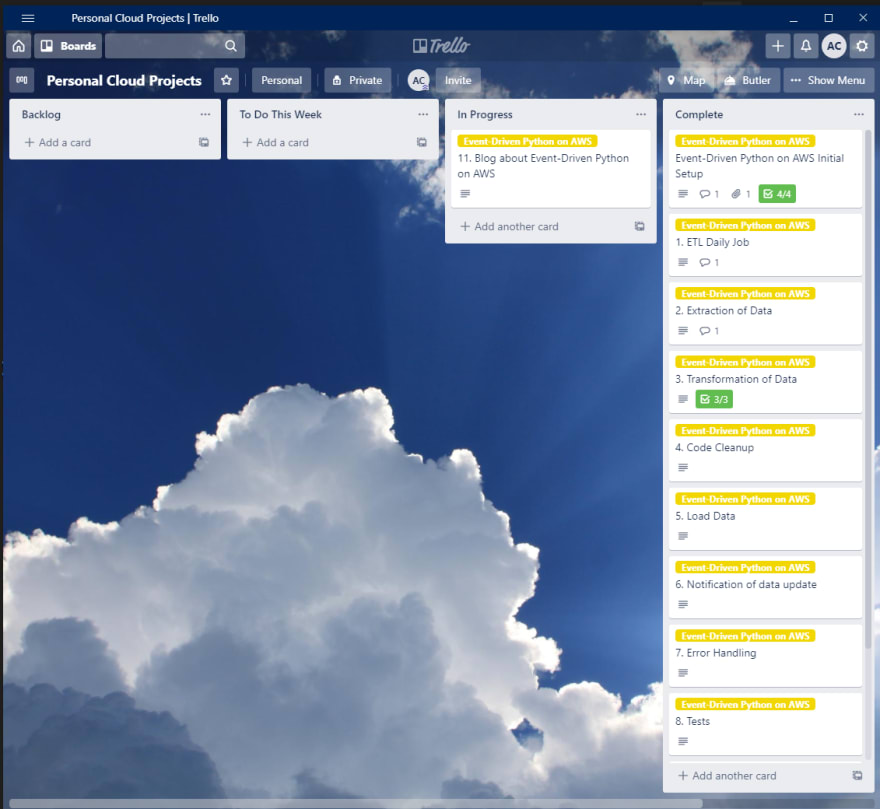
I'm such a huge fan of Trello, I love all the customization options to match my workflow and its very rewarding, for me at least, to punt that Trello task card over to my completed list. There's still so much more that I can do with it and I'm excited to dive into some of the automation options but I don't want to turn this into a Trello blog post so I won't go into too much detail. I created a card for each step that was listed on the challenge page and started working through them!
There's so much data
I am a newbie when it comes to this, I've never had to do data manipulation with this much data before so these were the steps that I had the most trouble with, I even broke VSCode a couple times because I iterated through a huge csv file oops...

First step was to extract the data from a csv source from the Ontario government. I had trouble initially as I wasn't sure how to do this and there were so many different ways to do this but I settled on using the csv and requests modules to get this working.
Next we had to transform the data and for me I created 3 new columns for daily numbers using loops to calculate the numbers. This was definitely challenging and caused my VSCode to crash a couple times because there were a couple of times where I iterated through the entire dataset instead of filtering it first and then iterating through it and my computer definitely did not like that. A couple of crashes later I filtered out the irrelevant data and got everything combined and neatly organized into a sweet list.
Finally we had to load the data into a DynamoDB table and thanks to my experience working on the Cloud Resume Challenge last month I was able to quickly complete this.
Everyone use CloudFormation as much as possible
If you read my last post you'll know that I am a huge fan of CloudFormation. I try to use it whenever possible and for this project I deployed everything using only two CloudFormation templates, I can't imagine going back to the days where I would deploy my infrastructure manually!
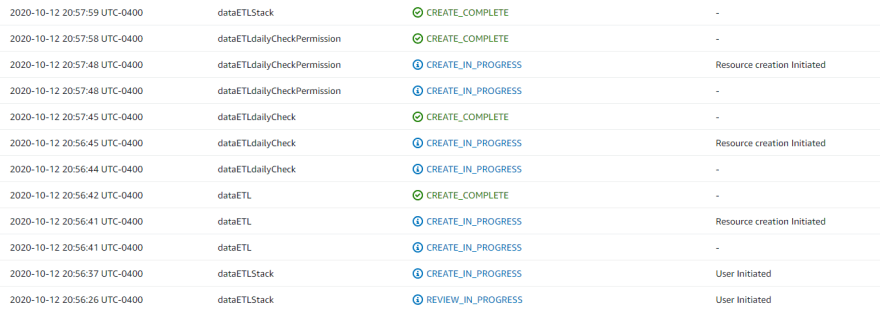
I had the mindset going into this project that if I was going to work on AWS I will use CloudFormation templates for everything I can. Working on this I learned even more about CloudFormation uses such as configuring CloudWatch events, setting up DynamoDB streams, and connecting that as a trigger for a notification Lambda! The best part for me about CloudFormation is that after making all the required changes to my code and templates I just SAM deploy it, go grab some water, and by the time I'm back my entire ETL Job is updated!
Finishing touches
After everything was deployed on AWS there was still some tasks to do in order to ensure everything works and is visualized in a nice way.
AWS SNS is not something I have worked a lot with but its important to this project because it updates me on whether my ETL Lambda is being triggered daily or if I run into any problems with loading the data into DynamoDB. First thing is to set up a notification in my ETL Lambda function that would let me know if there was any errors in loading the data into DynamoDB. I used a try except block in my Lambda function that would publish a message to an SNS topic if there was invalid data entries so I know that data is being regularly updated and is correct.
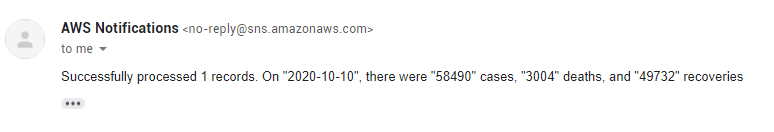
Next I needed to make sure that when there is a successful update that I also get a notification just so I know my table is up to date with today's information. I created a NotifyUpdates.js file and have it run whenever DynamoDB streams reports a successful update to the table. This message would tell me how many new rows are added (usually 1 a day) and what the info in those rows are.
Now for a cool way to display the data, I looked at a couple of different options and initially the plan was to go with AWS Quick Sight but after playing around with it and learning that first; it doesn't support DynamoDB, and second it wasn't publicly shareable I had to pivot to something else which is when I discovered Redash!
Data is beautiful
Redash is incredibly powerful but also very easy to use especially for someone like me who didn't have any experience querying databases or setting up dashboards.
First thing to do is spin up an EC2 instance using the Redash image ID which I got from their webpage. I quickly added this to my existing CloudFormation Template so I can easily deploy and update it when needed.
Next once the server was started I went through the web interface to go through the configuration, connect my DynamoDB database and started querying my data to create visualizations.
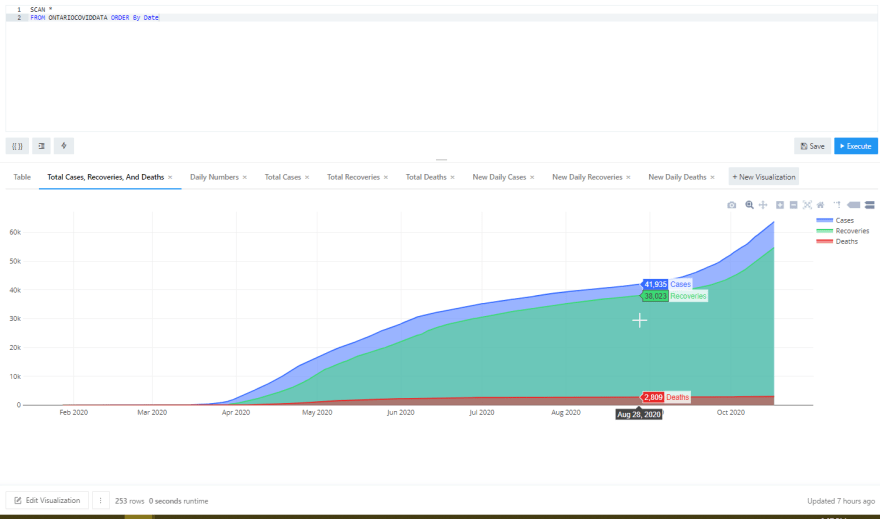
Everything was super simple to pick up and I had so many options to visualize my data. Designing the dashboard too was simple and I tried to put the most relevant data on screen and fit everything there. If anyone ever needs a dashboard for their database I highly recommend Redash.
Things I learned
I'm going to make it a habit to summarize a couple things that I learned in every project so I can one day go back on these blogs and see my progress!
- Manipulating csv's from internet sources using Python scripts
- Automating jobs using CloudWatch and Lambda with SNS Notifications
- Working with DynamoDB streams and new CloudFormation commands
- Trello is amazing and I should keep using it
- Redash is awesome and I will definitely try to implement this in my future projects.
Conclusion
There we have it, an automated ETL job that collects US COVID-19 data and displays it in a cool dashboard. I am happy with how everything turned out and everything I learned I will definitely use in the future. Going to try to keep blog posts coming monthly so thanks for reading my October 2020 post! See you in November!


Top comments (0)