In this post, we look at RedisTimeSeries module and build a custom web analytic tool with Redis & .NET 5 using C#
Application architecture Overview
Why use RedisTimeSeries module
Redis has been used for analytics applications since long and a search on platforms like github will provide multiple projects on similar lines.
The last couple of years has seen Redis being extended with modern data models and data processing tools (Document, Graph, Search, and Time Series).
These extensions enables development of certain kind of applications including near real time analytics applications much much easier as well as simpler.
RedisTimeSeries is a Redis module that adds a time series data structure to Redis with features such as...
- High volume inserts, low latency reads
- Query by start time and end-time
- Aggregated queries (min, max, avg, sum, range, count, first, last, STD.P, STD.S, Var.P, Var.S, twa) for any time bucket
- Configurable maximum retention period
- Downsampling / compaction for automatically updated aggregated timeseries
- Secondary indexing for time series entries. Each time series has labels (field value pairs) which will allows to query by labels
You will see most of these features in the demo application being developed.
A strong advise would be to study the Commands available which can be run from Redis CLI. All these commands map to the methods available in C# via NRedisTimeSeries - .Net Client for RedisTimeSeries
At a basic level, one creates a new time series using TS.CREATE and provide the retention period for each data point that goes in this time series.
You might want to delete the key prior to using TS.CREATE to ensure you do not receive an error in case the key exists.
Append a sample (data point) to the time series using TS.ADD
Access the last value using TS.GET or do aggregated queries using different methods.
Application architecture
In web analytic applications, at a high level, there are trackers /loggers, either javascript (in browser) or C#/Java/Python/NodeJS (serverside) or mobile app sdks which generate data. This data passes to a messaging layer such as kafka or pulsar or even redis and is consumed by applications to collect, validate, enrich and finally store in data stores where they would be analyzed.
If one is developing an IOT analytics application, the process would be similar but the data would in this case be generated by various sensors.
These trackers generate data from user events and sends lots of event attributes to the collector per event. For the demo application, to keep things simple, mock data is generated for a very limited number of attributes.
I call this application Redmetrix.
For the demo, this mock data is ingested by a .Net console application- Redmetrix Processor which saves the mock data in redis (in time series data structure).
The log files are in a format where every line is a valid json.
Ingestor reads the files line by line and adds data to Redis.
In the real world applications, one might have this logic preferably in azure function / aws lambda which would scale up/ down as needed.
Finally, we have a ASP.NET Core 5.0 web application using razor pages- Redmetrix Webapp which reads this data from redis and displays charts in a dashboard.
Though, in this article, we get the data in the page's codebehind file, in real world scenarios one would have a background worker which calls a service at specific intervals to get the necessary data from redis and sends the data via signalr to the clients using websockets and server side events.
Charts in Dashboard
The final article and the corresponding code in github repository will have the following charts
- Total PageViews (in last min) & comparison with a min prior
- Total Transactions
- Total Order Value (in Rupees)
- Page performance for Home page and Product page (in last min)
- Conversion Funnel (in last min)
- Orders by Payment Method (in last min)
Demo Infrastructure
Create Database on Redis Cloud
Sign up at Redis Cloud and / or Sign In
Select New DataBase Button.
Name the new database redmetrix and select Redis Stack radio button.

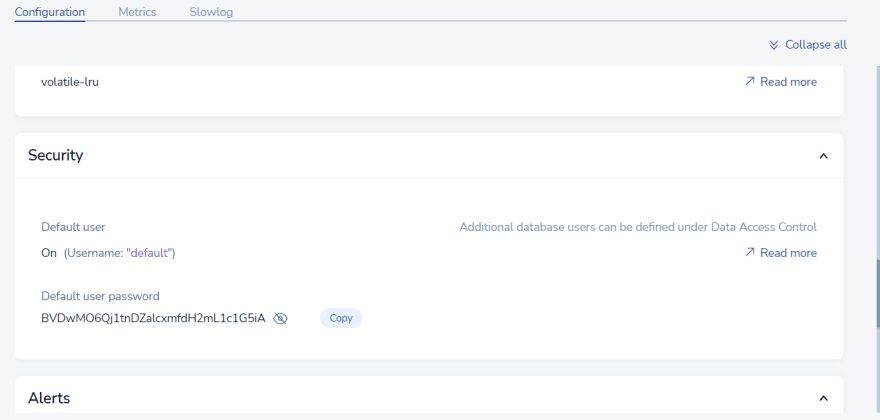
In the ensuing page where it shows the database configuration, please copy the public endpoint and password from General and Security section and keep it safe.

Generate Mock Data
One can use applications like Mockaroo to create dummy data.
Check out https://www.mockaroo.com/7d448f50 to see the one going to be used here.
The attributes used are
- application.app_id - Application Id, Can be a String or even a number
- application.platform - Denote whether a website or mobile app
- date_time.collector_tstamp_dt - DataTime when the event reached messaging layer or was enriched
- event_detail.event_type- Page Views or Form Change/Submit or Ecom Trasaction via event
- event_detail.event_id - Event Id- Guid
- contexts.page.type - Home/Category/Product. etc..
- contexts.performance_timing.domContentLoadedEventEnd - Page load end timing
- contexts.performance_timing.requestStart - Page load start timing
- contexts.transaction.amount_to_pay - Transaction Amount
- contexts.transaction.payment_method - Payment Method
For simplicity, all event types are Page Views but in real world applications, lions share of them are not going to be Page Views.
Also, Amount to Pay and Payment Method should be part of the event if and only if Page type is 'Success Confirmation'. But in the dummy data you would find these fields present in all events.
The Date field is randomly generated but in real world its going to be sequential. As we are not going to directly do anything with this field, this will not create any problems.
After downloading the mock data a couple of times, save them in a folder after renaming them as .txt files as though each line has json structure, the whole file does not(The file is not an array of json objects).
Developing Redmetrix
Visual Studio Code will be used for development in this article.
Processor
Create a base Console Application in the Terminal
dotnet new console -n "RedMetrixProcessor"
Move inside the RedMetrixProcessor directory
cd RedMetrixProcessor
Build and Run the application to ensure everything is working fine.
dotnet build
dotnet run
Open the folder RedMetrixProcessor in VSCode and add a New file named appsettings.json
Now copy the saved public endpoint and password from database configuration in the file as shown in code block
{
    "RedisOptions":{
        "EndPoints":"redis-14475.c280.us-central1-2.gce.cloud.redislabs.com:14475",
        "Password":"BVDwMO6Qj1tnDZalcxmfdH2mL1c1G5iA"
    }
}
The next step is to install the required nuget packages
dotnet add package Microsoft.Extensions.Hosting
dotnet add package Microsoft.Extensions.Configuration.Json
Normally console applications are not visually appealing. So, I will use a package Spectre.Console to make it colorful.
I'll not be getting into the features or the code parts of Spectre in this article. But the code is going to be available on github. Do check it out.
dotnet add package Spectre.Console
Finally, the packages required for Redis and RedisTimeSeries
dotnet add package StackExchange.Redis
dotnet add package NRedisTimeSeries
The above steps will add the below codeblock to your RedMetrixProcessor.csproj file
<ItemGroup>
    <PackageReference Include="Microsoft.Extensions.Configuration.Json" Version="6.0.0" />
    <PackageReference Include="Microsoft.Extensions.Hosting" Version="6.0.1" />
    <PackageReference Include="NRedisTimeSeries" Version="1.4.0" />
    <PackageReference Include="Spectre.Console" Version="0.44.0" />
    <PackageReference Include="StackExchange.Redis" Version="2.6.48" />
  </ItemGroup>
Add the following code to ensure that appsettings.json gets copied during build/run.
  <ItemGroup>
   <None Update="appsettings.json">
     <CopyToOutputDirectory>PreserveNewest</CopyToOutputDirectory>
   </None>
  </ItemGroup>
Update the Program.cs code to allow access to appsettings.json and connect to Redis DB.
using System;
using System.IO;
using Microsoft.Extensions.Configuration;
using Microsoft.Extensions.DependencyInjection;
using Microsoft.Extensions.Hosting;
using Spectre.Console;
using NRedisTimeSeries;
using NRedisTimeSeries.DataTypes;
using StackExchange.Redis;
namespace RedMetrixProcessor
{
    class Program
    {
        public static IConfigurationRoot configuration;
        static void Main(string[] args)
        {
            ServiceCollection serviceDescriptors = new ServiceCollection();

            ConfigureServices(serviceDescriptors);
            IServiceProvider serviceProvider = serviceDescriptors.BuildServiceProvider();

            var options = new ConfigurationOptions
                {
                    EndPoints = { configuration.GetSection("RedisOptions:EndPoints").Value },
                    Password = configuration.GetSection("RedisOptions:Password").Value,
                    Ssl = false
                };
            // Multiplexer is intended to be reused
            ConnectionMultiplexer redisMultiplexer = ConnectionMultiplexer.Connect(options);

            // The database reference is a lightweight passthrough object intended to be used and discarded
            IDatabase db = redisMultiplexer.GetDatabase();
            Console.WriteLine("Hello World!");
        }
        private static void ConfigureServices(IServiceCollection serviceCollection)
        {
            configuration = new ConfigurationBuilder()
                .SetBasePath(Directory.GetParent(AppContext.BaseDirectory).FullName)
                .AddJsonFile("appsettings.json")
                .Build();

            serviceCollection.AddSingleton<IConfigurationRoot>(configuration);


        }
    }
}
Create a new file ConfigureInitializationServices.cs with two methods DeleteKeys which deletes all data from database (if any data is present) and InitializeTimeSeriesTotalPageViews which creates a time series for pageviews with a retention period of 10 mins for each data point / sample.
using System;
using System.Collections.Generic;
using Microsoft.Extensions.Configuration;
using Spectre.Console;
using NRedisTimeSeries;
using NRedisTimeSeries.DataTypes;
using NRedisTimeSeries.Commands;
using StackExchange.Redis;
namespace RedMetrixProcessor
{
    public class ConfigureInitializationServices
    {
        private  readonly IConfigurationRoot _config;

        public ConfigureInitializationServices(IConfigurationRoot config)
        {
            _config = config;
        }

        public void DeleteKeys(IDatabase db)
        {


                db.KeyDelete("ts_pv:t"); //TimeSeries-PageView-Total

        }


        public void InitializeTimeSeriesTotalPageViews(IDatabase db)
        {

                db.TimeSeriesCreate("ts_pv:t", retentionTime: 600000);


        }

    }
}
The methods in github code repository is a lot more extensive with try catch blocks and Spectre.Console code.
Back in Program.cs, Update ConfigureServices method to ensure methods in ConfigureInitializationServices can be accessed from the mainmethod.
using System;
using System.IO;
using Microsoft.Extensions.Configuration;
using Microsoft.Extensions.DependencyInjection;
using Microsoft.Extensions.Hosting;
using Spectre.Console;
using NRedisTimeSeries;
using NRedisTimeSeries.DataTypes;
using StackExchange.Redis;
namespace RedMetrixProcessor
{
    class Program
    {
        public static IConfigurationRoot configuration;
        static void Main(string[] args)
        {
            ServiceCollection serviceDescriptors = new ServiceCollection();

            ConfigureServices(serviceDescriptors);
            IServiceProvider serviceProvider = serviceDescriptors.BuildServiceProvider();

            var options = new ConfigurationOptions
                {
                    EndPoints = { configuration.GetSection("RedisOptions:EndPoints").Value },
                    Password = configuration.GetSection("RedisOptions:Password").Value,
                    Ssl = false
                };
            // Multiplexer is intended to be reused
            ConnectionMultiplexer redisMultiplexer = ConnectionMultiplexer.Connect(options);

            // The database reference is a lightweight passthrough object intended to be used and discarded
            IDatabase db = redisMultiplexer.GetDatabase();

            AnsiConsole.Write(new FigletText("RedMetrix").LeftAligned().Color(Color.Red));
            AnsiConsole.Write(new Markup("[bold red]Copyright(C)[/] [teal]2021 Arnab Choudhuri - Xanadu[/]"));
            Console.WriteLine("");
            var rule = new Rule("[red]Welcome to RedMetrix[/]");
            AnsiConsole.Write(rule);

            var selectedoption = AnsiConsole.Prompt(
                                    new SelectionPrompt<string>()
                                        .Title("[bold yellow]Intitialize Application[/] [red]OR[/] [green]Process Data[/]?")
                                        .PageSize(5)
                                        .AddChoices(new[]
                                        {
                                            "Initialize Application", "Process Data", "Exit"
                                        }));
            if (selectedoption.ToString()=="Exit")
            {
                return;
            }else{
                if (!AnsiConsole.Confirm(selectedoption.ToString()))
                {
                    return;
                }
                else{
                     if (selectedoption.ToString()=="Initialize Application")
                     {
                        serviceProvider.GetService<ConfigureInitializationServices>().DeleteKeys(db);
                        serviceProvider.GetService<ConfigureInitializationServices>().InitializeTimeSeriesTotalPageViews(db);

                     }

                }
            }
            redisMultiplexer.Close();
            AnsiConsole.Write(new Markup("[bold yellow]Press any key to [/] [red]Exit![/]"));
            Console.ReadKey(false);
        }
        private static void ConfigureServices(IServiceCollection serviceCollection)
        {
            configuration = new ConfigurationBuilder()
                .SetBasePath(Directory.GetParent(AppContext.BaseDirectory).FullName)
                .AddJsonFile("appsettings.json")
                .Build();

            serviceCollection.AddSingleton<IConfigurationRoot>(configuration);
            serviceCollection.AddTransient<ConfigureInitializationServices>();


        }
    }
}
The application must be able to access the mock data files downloaded earlier from the development machine where this console application will run. To ensure the same, its time to add the folder location for the mock data file in appsettings.json.
{
    "RedisOptions":{
        "EndPoints":"redis-14475.c280.us-central1-2.gce.cloud.redislabs.com:14475",
        "Password":"BVDwMO6Qj1tnDZalcxmfdH2mL1c1G5iA"
    },
    "FolderPath":"D:\\redis\\article\\data"
}
Create a new file DataServices.cs which will traverse the folder for mock data file/s, read each line, and if the event type is 'Page View', add a datapoint with current timestamp and value 1(One). Do note the TSPageViews method.
using System;
using System.IO;
using System.Text;
using System.Text.Json;
using Microsoft.Extensions.Configuration;
using Spectre.Console;
using NRedisTimeSeries;
using StackExchange.Redis;
namespace RedMetrixProcessor
{
    public class DataServices
    {
        private  readonly IConfigurationRoot _config;

        public DataServices(IConfigurationRoot config)
        {
            _config = config;
        }

        public void ProcessData(IDatabase db)
        {
            string folderPath = _config.GetSection("FolderPath").Value;
            DirectoryInfo startDir = new DirectoryInfo(folderPath);
            var files = startDir.EnumerateFiles();
            AnsiConsole.Status()
                .AutoRefresh(true)
                .Spinner(Spinner.Known.Default)
                .Start("[yellow]Initializing ...[/]", ctx =>
                {
                    foreach (var file in files)
                    {
                        ctx.Status("[bold blue]Started Processing..[/]");
                        HandleFile(file,db);
                        AnsiConsole.MarkupLine($"[grey]LOG:[/] Done[grey]...[/]");
                    }
                });

            // Done
            AnsiConsole.MarkupLine("[bold green]Finished[/]");
        }

        private static void HandleFile(FileInfo file,IDatabase db)
        {

               Console.WriteLine(file.FullName);

              using var fs = new FileStream(file.FullName, FileMode.Open, FileAccess.Read);
              using var sr = new StreamReader(fs, Encoding.UTF8);
               // int count = 0;
                //int total =0;

                string line = String.Empty;

                while ((line = sr.ReadLine()) != null)
                {
                    try{

                        using JsonDocument doc = JsonDocument.Parse(line);
                        if(doc.RootElement.GetProperty("event_detail").GetProperty("event_type").GetString()=="Page view")
                        {
                                //total++;
                                TSPageViews(db);


                        }


                    }catch(Exception ex){
                       AnsiConsole.WriteException(ex);
                     Console.WriteLine(line);

                    }finally{

                    }

                }
           // Console.WriteLine($"{total}");
        }

        private static void TSPageViews( IDatabase db)
        {
            db.TimeSeriesAdd("ts_pv:t", "*", 1);
        }

    }
}
Once again in Program.cs, Update ConfigureServices method to ensure methods in DataServices can be accessed from the mainmethod.
serviceCollection.AddTransient<ConfigureInitializationServices>();
serviceCollection.AddTransient<DataServices>();
if (selectedoption.ToString()=="Initialize Application")
    {
        serviceProvider.GetService<ConfigureInitializationServices>().DeleteKeys(db);
        serviceProvider.GetService<ConfigureInitializationServices>().InitializeTimeSeriesTotalPageViews(db);

    }
if (selectedoption.ToString()=="Process Data")
    {
        serviceProvider.GetService<DataServices>().ProcessData(db);
    }
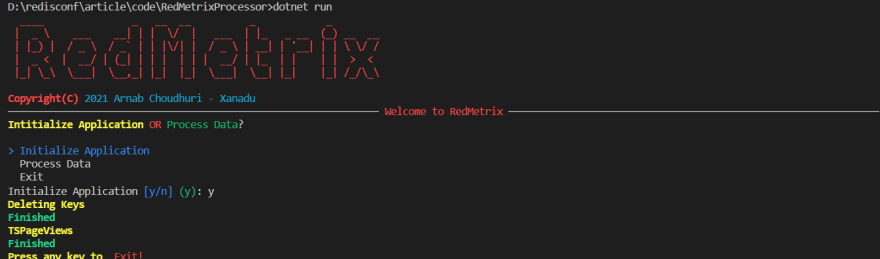
Now to try what is built by building and then running the application.
dotnet build
dotnet run
Select Intitialize Application from the choices and confirm the same.
Now to check if the application did what it was supposed to do using RedisInsight.
Install and Run RedisInsight

Select the option of Add Database manually
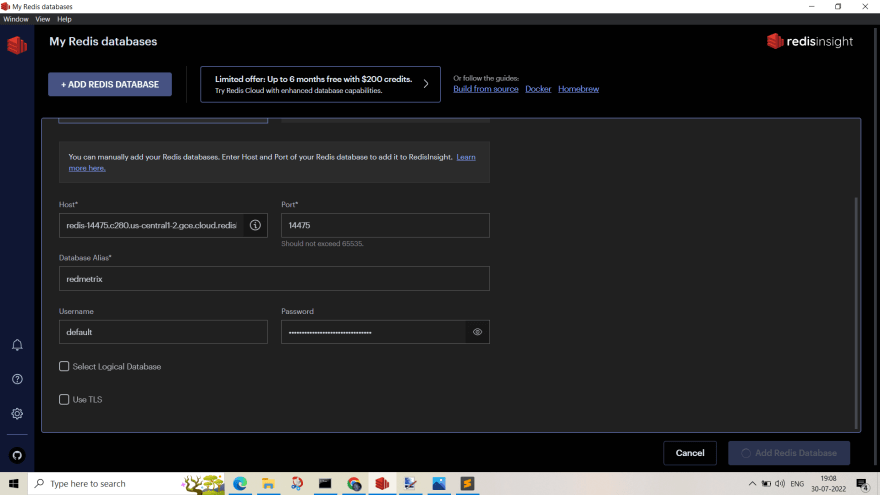
Redis Database gets listed in Redis Insight

Select Database Alias value -redmetrix to view the Key just added.

Run the application once again and this time select Process Data
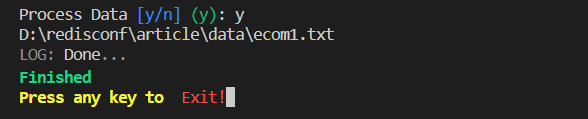
Confirm that the mock data files have been processed by running the query below to check for the number of data points/ samples in the database.
TS.RANGE ts_pv:t - + AGGREGATION sum 6000000
Later the same query will be run via .Net client in the web application.

Web Application
Create a base Razor Pages Web Application in the Terminal
dotnet new webapp -o RedMetrixWebApp
Move inside the directory and then build and run to confirm all works well.
In appsettings.json, add the RedisOptions section as is in RedMetrixProcessor.
Add the required nuget packages
dotnet add package StackExchange.Redis.Extensions.AspNetCore
dotnet add package StackExchange.Redis.Extensions.System.Text.Json
dotnet add package NRedisTimeSeries
Update the Program.cs code to allow access to appsettings.json
using System;
using System.Collections.Generic;
using System.Linq;
using System.Threading.Tasks;
using Microsoft.AspNetCore.Hosting;
using Microsoft.Extensions.Configuration;
using Microsoft.Extensions.Hosting;
using Microsoft.Extensions.Logging;

namespace RedMetrixWebApp
{
    public class Program
    {
        private static IConfigurationRoot Configuration { get; set; }
        public static void Main(string[] args)
        {
            CreateHostBuilder(args).Build().Run();
        }

        public static IHostBuilder CreateHostBuilder(string[] args) =>
            Host.CreateDefaultBuilder(args)
                .ConfigureAppConfiguration((hostContext, config) =>
               {
                   config.AddJsonFile("appsettings.json");
               })
                .ConfigureWebHostDefaults(webBuilder =>
                {
                    webBuilder.UseStartup<Startup>();
                    webBuilder.UseUrls("http://localhost:5003");
                });


    }
}
In Startup.cs file comment the line app.UseHttpsRedirection(); as https is not going to be used.
Now RedisProvider is added to the solution in the folder Provider.
Update Startup.cs - ConfigureServices method and add line
services.AddSingleton<RedisProvider>();
Do remember to add the namespace of RedisProvider to Startup.cs
Next, its time to get data for the PageViews Widget.
This will show Total PageViews (in last min) & comparison with a min prior, so two values.
So, there is a need to create a model to hold two values.
Create a new folder named Model and in that create a file RealTimeChart.cs.
using System;
using System.Collections.Generic;
namespace RedMetrixWebApp
{
    public class RealtimeChart
    {
        public PageView PageViews { get; set; }

        public DateTime Updated { get; set; }
    }

    public class PageView
    {
        public PageView(long pv, long prev_pv)
        {
            this.pv=pv;
            this.prev_pv=prev_pv;
        }
        public long pv { get; set; }
        public long prev_pv{ get; set; }
    }
}
Next, create a new folder named Services and in that create a file RealTimeChartService.cs.
using System;
using System.Collections.Generic;
using System.Text.Json;
using System.Linq;
using dotnetredis.Providers;
using NRedisTimeSeries;
using NRedisTimeSeries.Commands;
using NRedisTimeSeries.DataTypes;
using StackExchange.Redis;
using Microsoft.Extensions.Logging;


namespace RedMetrixWebApp
{
    public class RealtimeChartService
    {
        private readonly ILogger<RealtimeChartService> _logger;
        private readonly RedisProvider _redisProvider;

        public RealtimeChartService(ILogger<RealtimeChartService> logger, RedisProvider redisProvider)
        {
            _logger = logger;
            _redisProvider = redisProvider;
        }

        public RealtimeChart GetChartData()
        {
            return new RealtimeChart()
            {
                PageViews=GetPageViews(),
                Updated= DateTime.Now.ToLocalTime()

            };
        }


        public PageView GetPageViews()
        {
            PageView views = new PageView(0,0);
            try{
                var db = _redisProvider.Database();
                IReadOnlyList<TimeSeriesTuple> results =  db.TimeSeriesRevRange("ts_pv:t", "-", "+", aggregation: TsAggregation.Sum, timeBucket: 60000, count:2);

              views= new PageView(Convert.ToInt64(results[0].Val), Convert.ToInt64(results[1].Val));

            }catch(Exception ex){
                _logger.LogError(ex.Message);
            }
            return views;
        }

    }

}
Check the method GetPageViews to understand how the .Net Api method TimeSeriesRevRange gets the data.
Update Startup.cs - ConfigureServices method and add line
services.AddTransient<RealtimeChartService>();
Finally its time to show the data received from redis DB in the web pages.
Update Index.cshtml.cs code-behind file to get data using RealtimeChartService.
using System;
using System.Collections.Generic;
using System.Linq;
using System.Threading.Tasks;
using Microsoft.AspNetCore.Mvc;
using Microsoft.AspNetCore.Mvc.RazorPages;
using Microsoft.Extensions.Logging;
using RedMetrixWebApp;

namespace RedMetrixWebApp.Pages
{
    public class IndexModel : PageModel
    {
        private readonly ILogger<IndexModel> _logger;
        private readonly RealtimeChartService _service;

        public RealtimeChart chartdata { get; set; }

        public IndexModel(ILogger<IndexModel> logger, RealtimeChartService service)
        {
            _logger = logger;
            _service=service;
        }

        public void OnGet()
        {
           chartdata  =  _service.GetChartData();
            _logger.LogInformation("Worker running at: {Time} ", chartdata.Updated);
        }

    }
}
Finally, its time to create the the view.
The data from .cshtml.cs file can be accessed via Model in .cshtml using var chartData = @Html.Raw(Json.Serialize(Model.chartdata));
Structure of the dashboard is using gridstack.js.
Widget design is using handlebars.js
In the grid where pageviews widget will go, do note the presence of a div with id wpageviews. This is where handlebar templates will get injected.
@page
@model IndexModel
@{Layout = null;
}
<!doctype html>
<html lang="en">
<head>
    <meta charset="utf-8">
    <meta name="viewport" content="width=device-width, initial-scale=1.0">
    <meta name="description" content="RedMetrix - RedisTimeSeries ECOM Web analytics Dashboard">
    <title>RedMetrix - A RedisTimeSeries Project</title>
    <link rel="stylesheet" href="~/lib/bootstrap/dist/css/bootstrap.min.css" />
    <link rel="stylesheet" href="~/css/gridstack.css" />

    <style>
    body {
    background: #222222;
    color: #465665;
      }
    .grid-stack-item {
        border: 0;
      }
    .grid-stack-item-content {
        background-color: white;
        text-align: center;
      }
    #blue{
        background: #0000ff;
      }
    </style>
</head>
<body>

  <div class="grid-stack" id="simple-grid"></div>
  <script src="~/lib/jquery/dist/jquery.min.js"></script>
  <script src="~/lib/bootstrap/dist/js/bootstrap.bundle.min.js"></script>
  <script src="//cdn.jsdelivr.net/npm/handlebars@latest/dist/handlebars.js"></script>
  <script src="~/js/gridstack-jq.js" ></script>
  <script type="text/javascript">
    var simple = [
      {x: 0, y: 0, w: 4, h: 2, noMove: true, noResize: true, locked: true, id:'logo', bgcolor:'#9c4274',content: '<img src="widgets/logo/logo.png" alt="logo RedMetrix" style="width:100%;margin-top: auto;"> <h2 style="color:white;"><strong> -- A RedisTimeSeries Project </strong> </h2>'},
      {x: 4, y: 0, w: 4, h: 6, noMove: true, noResize: true, locked: true, id:'pageperf', bgcolor:'#e83e8c',content: '<h5 style="color:whitesmoke">Page Performance <br/> (in ms) </h5> <div><h6 style="color:white">Home </h6><p/><canvas id ="wpageperfh"></canvas> </div><p/><div><h6 style="color:white">Product </h6></p><canvas id ="wpageperfp"></canvas> </div>'},
      {x: 8, y: 0, w: 2, h: 2,noMove: true, noResize: true, locked: true, id:'pageviews', bgcolor:'#12b0c5', content: '<div id ="wpageviews" style="width: 100%; height: 100%"></div>'},
      {x: 10, y: 0, w: 2, h: 2,noMove: true, noResize: true, locked: true, id:'totalorders', bgcolor:'#ff9618', content: '<div id ="wtotalorders" style="width: 100%; height: 100%"></div>'},
      {x: 0, y: 2, w: 4, h: 4, noMove: true, noResize: true, locked: true, id:'conversions', bgcolor:'#ec663c', content: '<h5 style="color:whitesmoke">Conversions </h5> <div><canvas id ="wconversions"></canvas> </div></p></p> <h5 style="color:whitesmoke">Conversion Rate </h5><div id="wconversionrate" style="font-size: 400%; color:lightgreen;"></div>'},
      {x: 8, y: 2, w: 4, h: 1,noMove: true, noResize: true, locked: true, id:'ordervalue', bgcolor:'#dc5945', content: '<div id ="wordervalue" style="width: 100%; height: 100%"></div>'},
      {x: 8, y: 3, w: 4, h: 3,noMove: true, noResize: true, locked: true, id:'ordbypaymeth', bgcolor:'#47bbb3', content: '<h5 style="color:whitesmoke">Orders By Payment Method </h5> <div><canvas id ="wordbypaymeth"></canvas> </div>'}
    ];

    var simpleGrid = GridStack.init({

    }, '#simple-grid');
    simpleGrid.on('added', function(e, items) {
      items.forEach(function(item) {
        item.el.firstElementChild.style.backgroundColor=item.bgcolor;
      });
    });
    simpleGrid.load(simple);
  </script>

  <script>
  Handlebars.registerHelper('isdefined', function (value) {
    return value !== undefined;
    });
  Handlebars.registerHelper('isnumber', function (value) {
    return !isNaN(value);
    });
  Handlebars.registerHelper('showchange', function (value) {
    return value !== undefined || !isNaN(value) || value !==0;
    });

  </script>
  <script id="pageview_template" type="text/x-handlebars-template">
    <div class="entry">
      <h5 style="color:whitesmoke">{{pageview.title}}</h5>
      <div class="pageview" style="width: 100%; height: 83%">
        <div class= "views" style="font-size: 400%; color:#ff9618;">{{pageview.views}}</div>
        <div class= "views"><h5 style="color:#ff9618">Last value : {{pageview.last}}</h5></div>
        <div class="change" style="color:white"><h3>{{#if (showchange pageview.diff)}} <span>({{pageview.change}}) {{pageview.diff}}%</span>{{/if}} </h3></div>
      </div>
    </div>
  </script>
  <script>
  var pageview_source = document.getElementById("pageview_template").innerHTML;
  var pageviewTemplate = Handlebars.compile(pageview_source);

  </script>
  <script>
    function percentage(n, total) {
    return Math.round(n * 100 / total);
  }
  function shortnumber(num) {
    if (isNaN(num)) {
      return num;
    }
    if (num >= 1000000000) {
      return (num / 1000000000).toFixed(1) + 'B';
    } else if (num >= 1000000) {
      return (num / 1000000).toFixed(1) + 'M';
    } else if (num >= 1000) {
      return (num / 1000).toFixed(1) + 'K';
    } else {
      return num;
    }
  };
  $(document).ready(function () {
  var chartData = @Html.Raw(Json.Serialize(Model.chartdata));
  console.log(chartData);
  var pageviews=0;
  var lastpv=0;
  var pageviewdiff=0;
  var pageviewchange="";
      if (!isNaN(chartData.pageViews.pv)){
            pageviews=chartData.pageViews.pv;
            if (!isNaN(chartData.pageViews.prev_pv)){
              lastpv=chartData.pageViews.prev_pv;
                var diff=0;
                if(chartData.pageViews.prev_pv>chartData.pageViews.pv){
                    diff=chartData.pageViews.prev_pv-chartData.pageViews.pv;
                    pageviewchange="-"
                }else{
                    diff=chartData.pageViews.pv-chartData.pageViews.prev_pv;
                    pageviewchange="+";
                }
                pageviewdiff=percentage(diff,pageviews);

              }
          }

        var context={
            pageview: {
            title:"Page Views",
            views: shortnumber(pageviews),
            last:shortnumber(lastpv),
            change: pageviewchange,
            diff:pageviewdiff
            }
        };
        document.getElementById("wpageviews").innerHTML = pageviewTemplate(context);

  });

  </script>
</body>
</html>
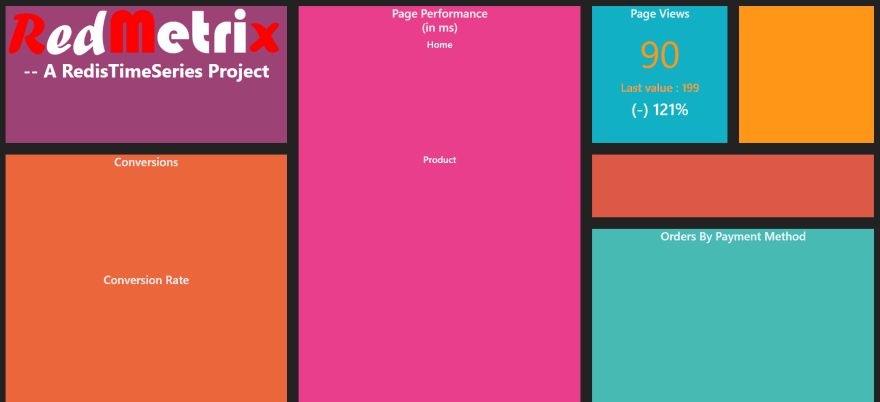
And the result is
Rest of the Widgets
Total number of Orders / Transactions and Total Order Value (in Rupees)
Unlike Total page views use case where page views in last min were shown, one might also have use cases where the total value from start of business or even current financial year needs to be shown.
Processor
Add this section in the Processor appsettings.json file. This will have the values of the said data at the time when this application will run.
"InitializationOptions":{
        "TotalOrders":0,
        "TotalOrderValue":0.00
    }
In real world scenarios, you would make a Api call to your enterprise systems to get the values.
In ConfigureInitializationServices.cs, create a method that will create necessary keys and add the values from appsettings.json.
public void InitializeTimeSeriesTotalOrderNValue(IDatabase db)
        {
                db.TimeSeriesCreate("ts_o:t", retentionTime: 600000);
                ulong totalorders=0;
                // TODO: Get Data from Rest Api for total orders.
                totalorders=Convert.ToUInt64(_config.GetSection("InitializationOptions:TotalOrders").Value);
                db.TimeSeriesAdd("ts_o:t", "*", Convert.ToDouble(totalorders));
                db.TimeSeriesCreate("ts_o:v", retentionTime: 600000);
                double totalordervalue=0;
                // TODO: Get Data from Rest Api for total order value
                totalordervalue=Convert.ToDouble(_config.GetSection("InitializationOptions:TotalOrderValue").Value);
                db.TimeSeriesAdd("ts_o:v", "*", totalordervalue);


        }
Do remember to update DeleteKeys method as well.
Similarly in DataServices.cs, add the following method and call the method in HandleFile method with the orderamount value when the page type is Success Confirmation.
HandleFile method not shown here. Check code repository if needed.
private static void TSOrders( double orderamount, IDatabase db)
        {
           db.TimeSeriesIncrBy("ts_o:t", 1, timestamp: "*");
           db.TimeSeriesIncrBy("ts_o:v", orderamount, timestamp: "*");
        }
The corresponding Command for CLI would be TS.INCRBY ts_o:t 1 TIMESTAMP *
Webapp
Update RealtimeChartService with method that uses TS.GET to get the last data in the timeseries samples.
public double GetOrderValue()
        {
            double orderamount = 0;
            try{
                var db = _redisProvider.Database();
                TimeSeriesTuple value = db.TimeSeriesGet("ts_o:v");
                orderamount = value.Val;
            }catch(Exception ex){
                _logger.LogError(ex.Message);
            }
            return orderamount;
        }

        public long GetOrders()
        {
            long orders = 0;
            try{
                var db = _redisProvider.Database();
                TimeSeriesTuple value = db.TimeSeriesGet("ts_o:t");
                orders=Convert.ToInt64(value.Val);
            }catch(Exception ex){
                _logger.LogError(ex.Message);
            }
            return orders;
        }
Page performance for Home page and Product page (in last min)
Processor
Initialize
db.TimeSeriesCreate("ts_pv:pp:h", retentionTime: 600000);
db.TimeSeriesCreate("ts_pv:pp:p", retentionTime: 600000);
and then..
private static ulong GetStartTime( JsonElement context)
        {
            string s_starttime=context.GetProperty("performance_timing").GetProperty("requestStart").GetString();
            ulong starttime=Convert.ToUInt64(s_starttime);
            return starttime;
        }
        private static ulong GetEndTime( JsonElement context)
        {
            string s_endtime=context.GetProperty("performance_timing").GetProperty("domContentLoadedEventEnd").GetString();
            ulong endtime=Convert.ToUInt64(s_endtime);
            return endtime;
        }

        private static void TSPagePerformance( string pagetype,long pageperf, IDatabase db)
        {
            if (pagetype=="Home"){
                db.TimeSeriesAdd("ts_pv:pp:h", "*", pageperf);
            }else if(pagetype=="Product"){
                db.TimeSeriesAdd("ts_pv:pp:p", "*", pageperf);
            }else{}
        }
In the source code in source repository there are two additional methods commented to get start time and end time with seven performance attributes instead of two.
Webapp
Here, we will show page performance with floating bars denoting max and min whereas avg will be a line chart.
In RealtimeChart Model
public class PagePerf
    {
        public List<string> time {get;set;}
        public List<List<int>> maxmin {get;set;}
        public List<int> avg{get;set;}
    }
and in RealtimeChartService
public PagePerf GetPagePerformance(string pagetype){
            string key="";
            if (pagetype=="Home")
            {
                key="ts_pv:pp:h";
            }else if(pagetype=="Product")
            {
                key="ts_pv:pp:p";
            }else{}
            List<int> avgdata=new List<int>();
            List<string> timedata= new List<string>();
            List<List<int>> maxmindata= new List<List<int>>();
            try{
                var db = _redisProvider.Database();

                IReadOnlyList<TimeSeriesTuple> resultsmax =  db.TimeSeriesRange(key, "-", "+", aggregation: TsAggregation.Max, timeBucket: 60000, count:10);
                IReadOnlyList<TimeSeriesTuple> resultsmin =  db.TimeSeriesRange(key, "-", "+", aggregation: TsAggregation.Min, timeBucket: 60000, count:10);
                IReadOnlyList<TimeSeriesTuple> resultsavg =  db.TimeSeriesRange(key, "-", "+", aggregation: TsAggregation.Avg, timeBucket: 60000, count:10);
                maxmindata=GetMaxMinList(resultsmax,resultsmin);
                foreach (var result in resultsavg)
                {
                  avgdata.Add(Convert.ToInt32(result.Val));
                }
                timedata=GetStringTimeList(resultsavg);

            }catch(Exception ex){
                _logger.LogError(ex.Message);
            }
            return new PagePerf
            {
                time=timedata,
                maxmin=maxmindata,
                avg=avgdata
            };
        }

        private List<List<int>> GetMaxMinList(IReadOnlyList<TimeSeriesTuple> resultsmax,IReadOnlyList<TimeSeriesTuple> resultsmin)
        {
            return resultsmax.Concat(resultsmin)
                                .GroupBy(o => o.Time)
                                .Select(g => g.Select(s => (int)s.Val).ToList())
                                .ToList();
        }

        private List<string> GetStringTimeList(IReadOnlyList<TimeSeriesTuple> resultsavg)
        {
             List<string> timedata= new List<string>();
             foreach (var result in resultsavg)
                {
                   TimeStamp ts = result.Time;
                   System.DateTime dtDateTime = new DateTime(1970, 1, 1, 0, 0, 0, 0, System.DateTimeKind.Utc);
                   dtDateTime = dtDateTime.AddMilliseconds((long)ts);
                   String hourMinute = dtDateTime.ToString("HH:mm");
                   timedata.Add(hourMinute);
                }
                return timedata;
        }
Conversion Funnel (in last min)
Processor
Initialize
var label = new TimeSeriesLabel("chart", "Funnel");
                var labels = new List<TimeSeriesLabel> { label };
                db.TimeSeriesCreate("ts_fnl:pl", retentionTime: 600000, labels: labels);
                db.TimeSeriesAdd("ts_fnl:pl", "*", 0);
                db.TimeSeriesCreate("ts_fnl:pd", retentionTime: 600000, labels: labels);
                db.TimeSeriesAdd("ts_fnl:pd", "*", 0);
                db.TimeSeriesCreate("ts_fnl:ac", retentionTime: 600000, labels: labels);
                db.TimeSeriesAdd("ts_fnl:ac", "*", 0);
                db.TimeSeriesCreate("ts_fnl:vc", retentionTime: 600000, labels: labels);
                db.TimeSeriesAdd("ts_fnl:vc", "*", 0);
                db.TimeSeriesCreate("ts_fnl:co", retentionTime: 600000, labels: labels);
                db.TimeSeriesAdd("ts_fnl:co", "*", 0);
                db.TimeSeriesCreate("ts_fnl:sc", retentionTime: 600000, labels: labels);
                db.TimeSeriesAdd("ts_fnl:sc", "*", 0);
Corresponding command will be TS.CREATE ts_fnl:pl RETENTION 600000 LABELS chart Funnel
And then
private static void TSFunnel( string funneltype,IDatabase db)
        {
            switch (funneltype)
                {
                    case "Success":

                       db.TimeSeriesAdd("ts_fnl:sc", "*", 1);
                        break;
                    case "Checkout":

                        db.TimeSeriesAdd("ts_fnl:co", "*", 1);
                        break;
                    case "ViewCart":

                        db.TimeSeriesAdd("ts_fnl:vc", "*", 1);
                        break;
                    case "AddToCart":

                        db.TimeSeriesAdd("ts_fnl:ac", "*", 1);
                        break;
                    case "ProductDetail":

                        db.TimeSeriesAdd("ts_fnl:pd", "*", 1);
                        break;
                    case "ProductList":

                        db.TimeSeriesAdd("ts_fnl:pl", "*", 1);
                        break;
                    default:
                         AnsiConsole.MarkupLine($"[red]{funneltype}[/]");
                        break;
                }
        }
Webapp
This will be showcased as a horizontal bar chart.
In the RealtimeChart model
public class Conversion
    {
        public List<FunnelItem> FunnelItems{get;set;}
        public long TotalFunnelValue{get;set;}
       // public double ConversionRate{get;set;}
    }
    public class FunnelItem
    {
        public FunnelItem(int Order, string Item, long Value)
    {
        this.Order=Order;
        this.Item = Item;
        this.Value = Value;
    }
       public int Order { get; set; }
       public string Item { get; set; }
       public long Value { get; set; }

    }
And, in RealtimeChartService
public Conversion GetConversions(){
            List<FunnelItem> funnelItems = new List<FunnelItem>();
            long totalFunnelValue =0;
            try{
                var db = _redisProvider.Database();
                var filter = new List<string> { "chart=Funnel" };

               var results= db.TimeSeriesMRevRange("-", "+", filter, aggregation:TsAggregation.Sum, timeBucket:600000, count: 1);

                foreach (var result in results)
                {
                    string key = result.key;
                    IReadOnlyList<TimeSeriesTuple> values = result.values;
                    funnelItems.Add(new FunnelItem(GetFunnelOrder(key),PrettyFunnelItem(key),Convert.ToInt64(values[0].Val)));
                    totalFunnelValue=totalFunnelValue+Convert.ToInt64(values[0].Val);
                }
            }catch(Exception ex){
                _logger.LogError(ex.Message);
            }
            return new Conversion
            {
                FunnelItems=funnelItems,
                TotalFunnelValue=totalFunnelValue
            };
        }

        private int GetFunnelOrder(string key){
           switch (key)
                {
                    case "ts_fnl:sc":
                        return 6;
                    case "ts_fnl:co":
                        return 5;
                    case "ts_fnl:vc":
                        return 4;
                    case "ts_fnl:ac":
                        return 3;
                    case "ts_fnl:pd":
                        return 2;
                    case "ts_fnl:pl":
                        return 1;
                    default:
                        _logger.LogInformation(key);
                    break;
                }
            return 0;
        }
        private string PrettyFunnelItem(string key){
           switch (key)
                {
                    case "ts_fnl:sc":
                        return "Transaction Success";
                    case "ts_fnl:co":
                        return "Checkout";
                    case "ts_fnl:vc":
                        return "View Cart";
                    case "ts_fnl:ac":
                        return "Add To Cart";
                    case "ts_fnl:pd":
                        return "Product Detail";
                    case "ts_fnl:pl":
                        return "Product Listings";
                    default:
                        _logger.LogInformation(key);
                    break;
                }
            return "";
        }
The command used is TS.MREVRANGE - + AGGREGATION sum 600000 FILTER chart=Funnel
Orders by Payment Method (in last min)
Processor
Initialize
var label = new TimeSeriesLabel("chart", "Ordersbypaymenttype");
                var labels = new List<TimeSeriesLabel> { label };
                db.TimeSeriesCreate("ts_o:t:cod", retentionTime: 600000, labels: labels);
                db.TimeSeriesAdd("ts_o:t:cod", "*", 0);
                db.TimeSeriesCreate("ts_o:t:dc", retentionTime: 600000, labels: labels);
                db.TimeSeriesAdd("ts_o:t:dc", "*", 0);
                db.TimeSeriesCreate("ts_o:t:cc", retentionTime: 600000, labels: labels);
                db.TimeSeriesAdd("ts_o:t:cc", "*", 0);
                db.TimeSeriesCreate("ts_o:t:nb", retentionTime: 600000, labels: labels);
                db.TimeSeriesAdd("ts_o:t:nb", "*", 0);
                db.TimeSeriesCreate("ts_o:t:ap", retentionTime: 600000, labels: labels);
                db.TimeSeriesAdd("ts_o:t:ap", "*", 0);
                db.TimeSeriesCreate("ts_o:t:gp", retentionTime: 600000, labels: labels);
                db.TimeSeriesAdd("ts_o:t:gp", "*", 0);
And then
private static void TSOrdersbypaymenttype( string paymentmethod, IDatabase db)
        {
           switch (paymentmethod)
                {
                    case "Cash On Delivery":

                       db.TimeSeriesAdd("ts_o:t:cod", "*", 1);
                        break;
                    case "Debit Card":

                        db.TimeSeriesAdd("ts_o:t:dc", "*", 1);
                        break;
                    case "Credit Card":

                        db.TimeSeriesAdd("ts_o:t:cc", "*", 1);
                        break;
                    case "Netbanking":

                        db.TimeSeriesAdd("ts_o:t:nb", "*", 1);
                        break;
                    case "Amazon Pay":

                        db.TimeSeriesAdd("ts_o:t:ap", "*", 1);
                        break;
                    case "Google Pay":

                        db.TimeSeriesAdd("ts_o:t:gp", "*", 1);
                        break;
                    default:
                         AnsiConsole.MarkupLine($"[red]{paymentmethod}[/]");
                        break;
                }
        }
Webapp
In RealtimeChart model
public class PaymentMethodOrders
    {
        public PaymentMethodOrders(string PaymentMethod, long Orders)
        {
        this.PaymentMethod = PaymentMethod;
        this.Orders = Orders;
        }
       public string PaymentMethod { get; set; }
       public long Orders { get; set; }
    }
And then in RealtimeChartService
public List<PaymentMethodOrders> GetOrdersByPaymentMethod(){
            List<PaymentMethodOrders> OrdersByPaymentMethod = new List<PaymentMethodOrders>();
            try{
                var db = _redisProvider.Database();
                var filter = new List<string> { "chart=Ordersbypaymenttype" };

               var results= db.TimeSeriesMRevRange("-", "+", filter, aggregation:TsAggregation.Sum, timeBucket:600000, count: 1);
            //      string jsonString = JsonSerializer.Serialize(results);
            //   _logger.LogInformation(jsonString);
                foreach (var result in results)
                {
                    string key = result.key;
                   IReadOnlyList<TimeSeriesTuple> values = result.values;
                    OrdersByPaymentMethod.Add(new PaymentMethodOrders(PrettyPaymentMethod(key),Convert.ToInt64(values[0].Val)));
                }
            }catch(Exception ex){
                _logger.LogError(ex.Message);
            }

            return OrdersByPaymentMethod;
        }

        private string PrettyPaymentMethod(string key){
           switch (key)
                {
                    case "ts_o:t:cod":
                        return "Cash On Delivery";
                    case "ts_o:t:dc":
                        return "Debit Card";
                    case "ts_o:t:cc":
                        return "Credit Card";
                    case "ts_o:t:nb":
                        return "Net Banking";
                    case "ts_o:t:ap":
                        return "Amazon Pay";
                    case "ts_o:t:gp":
                        return "Google Pay";
                    default:
                        _logger.LogInformation(key);
                    break;
                }
            return "";
        }
The final view
Chart.js is used for charting.
Dashboard is refreshed using meta http-equiv="refresh"
@page
@model IndexModel
@{Layout = null;
}
<!doctype html>
<html lang="en">
<head>
<meta charset="utf-8">
<meta name="viewport" content="width=device-width, initial-scale=1.0">
<meta http-equiv="refresh" content="60" />
<meta name="description" content="RedMetrix - RedisTimeSeries ECOM Web analytics Dashboard">
<title>RedMetrix - A RedisTimeSeries Project</title>
<link rel="stylesheet" href="~/lib/bootstrap/dist/css/bootstrap.min.css" />
<link rel="stylesheet" href="~/css/gridstack.css" />
<style>
body {
background: #222222;
color: #465665;
}
.grid-stack-item {
border: 0;
}
.grid-stack-item-content {
background-color: white;
text-align: center;
}
#blue{
background: #0000ff;
}
</style>
</head>
<body>
<div class="grid-stack" id="simple-grid"></div>
<script src="~/lib/jquery/dist/jquery.min.js"></script>
<script src="~/lib/bootstrap/dist/js/bootstrap.bundle.min.js"></script>
<script src="//cdn.jsdelivr.net/npm/handlebars@latest/dist/handlebars.js"></script>
<script src="//cdn.jsdelivr.net/npm/chart.js"></script>
<script src="~/js/gridstack-jq.js" ></script>
<script type="text/javascript">
var simple = [
{x: 0, y: 0, w: 4, h: 2, noMove: true, noResize: true, locked: true, id:'logo', bgcolor:'#9c4274',content: '<img src="widgets/logo/logo.png" alt="logo RedMetrix" style="width:100%;margin-top: auto;"> <h2 style="color:white;"><strong> -- A RedisTimeSeries Project </strong> </h2>'},
{x: 4, y: 0, w: 4, h: 6, noMove: true, noResize: true, locked: true, id:'pageperf', bgcolor:'#e83e8c',content: '<h5 style="color:whitesmoke">Page Performance <br/> (in ms) </h5> <div><h6 style="color:white">Home </h6><p/><canvas id ="wpageperfh"></canvas> </div><p/><div><h6 style="color:white">Product </h6></p><canvas id ="wpageperfp"></canvas> </div>'},
{x: 8, y: 0, w: 2, h: 2,noMove: true, noResize: true, locked: true, id:'pageviews', bgcolor:'#12b0c5', content: '<div id ="wpageviews" style="width: 100%; height: 100%"></div>'},
{x: 10, y: 0, w: 2, h: 2,noMove: true, noResize: true, locked: true, id:'totalorders', bgcolor:'#ff9618', content: '<div id ="wtotalorders" style="width: 100%; height: 100%"></div>'},
{x: 0, y: 2, w: 4, h: 4, noMove: true, noResize: true, locked: true, id:'conversions', bgcolor:'#ec663c', content: '<h5 style="color:whitesmoke">Conversions </h5> <div><canvas id ="wconversions"></canvas> </div></p></p> <h5 style="color:whitesmoke">Conversion Rate </h5><div id="wconversionrate" style="font-size: 400%; color:lightgreen;"></div>'},
{x: 8, y: 2, w: 4, h: 1,noMove: true, noResize: true, locked: true, id:'ordervalue', bgcolor:'#dc5945', content: '<div id ="wordervalue" style="width: 100%; height: 100%"></div>'},
{x: 8, y: 3, w: 4, h: 3,noMove: true, noResize: true, locked: true, id:'ordbypaymeth', bgcolor:'#47bbb3', content: '<h5 style="color:whitesmoke">Orders By Payment Method </h5> <div><canvas id ="wordbypaymeth"></canvas> </div>'}
];
var simpleGrid = GridStack.init({
}, '#simple-grid');
simpleGrid.on('added', function(e, items) {
items.forEach(function(item) {
item.el.firstElementChild.style.backgroundColor=item.bgcolor;
});
});
simpleGrid.load(simple);
</script>
<script>
Handlebars.registerHelper('isdefined', function (value) {
return value !== undefined;
});
Handlebars.registerHelper('isnumber', function (value) {
return !isNaN(value);
});
Handlebars.registerHelper('showchange', function (value) {
return value !== undefined || !isNaN(value) || value !==0;
});
</script>
<script id="pageview_template" type="text/x-handlebars-template">
<div class="entry">
<h5 style="color:whitesmoke">{{pageview.title}}</h5>
<div class="pageview" style="width: 100%; height: 83%">
<div class= "views" style="font-size: 400%; color:#ff9618;">{{pageview.views}}</div>
<div class= "views"><h5 style="color:#ff9618">Last value : {{pageview.last}}</h5></div>
<div class="change" style="color:white"><h3>{{#if (showchange pageview.diff)}} <span>({{pageview.change}}) {{pageview.diff}}%</span>{{/if}} </h3></div>
</div>
</div>
</script>
<script id="totalorders_template" type="text/x-handlebars-template">
<div class="entry">
<h5 style="color:whitesmoke">{{totalorders.title}}</h5>
<div class="pageview" style="width: 100%; height: 83%">
<div class= "views" style="font-size: 500%; color:#12b0c5">{{totalorders.orders}}</div>
</div>
</div>
</script>
<script id="totalsales_template" type="text/x-handlebars-template">
<div class="entry">
<h5 style="color:whitesmoke">{{totalordervalue.title}}</h5>
<div class="pageview" style="width: 100%; height: 83%">
<div class= "views"><h1 style="color:#ff9618"; font-size: 250%;>₹ {{totalordervalue.orderValue}}</h1></div>
</div>
</div>
</script>
<script>
var pageview_source = document.getElementById("pageview_template").innerHTML;
var pageviewTemplate = Handlebars.compile(pageview_source);
var totalorders_source = document.getElementById("totalorders_template").innerHTML;
var totalordersTemplate = Handlebars.compile(totalorders_source);
var totalsales_source = document.getElementById("totalsales_template").innerHTML;
var totalsalesTemplate = Handlebars.compile(totalsales_source);
</script>
<script>
function percentage(n, total) {
return Math.round(n * 100 / total);
}
function shortnumber(num) {
if (isNaN(num)) {
return num;
}
if (num >= 1000000000) {
return (num / 1000000000).toFixed(1) + 'B';
} else if (num >= 1000000) {
return (num / 1000000).toFixed(1) + 'M';
} else if (num >= 1000) {
return (num / 1000).toFixed(1) + 'K';
} else {
return num;
}
};
var orderbypaychartdata= {
labels: [],
datasets: [{
label: 'Orders',
data: [],
borderColor: 'rgb(255, 99, 132)',
backgroundColor: 'rgb(255, 99, 132)',
borderWidth: 2,
borderRadius: 5,
borderSkipped: false,
order: 1
}]
};
var orderbypaychartconfig = {
type: 'bar',
data: orderbypaychartdata,
options: {
responsive: true,
plugins: {
legend: {
display: false,
}
}
}
};
var orderbypayChart = new Chart(
document.getElementById('wordbypaymeth'),
orderbypaychartconfig
);
const pageperfhomechartdata = {
labels: [],
datasets: [
{
label: 'Max-Min',
data: [],
borderColor: 'rgb(54, 162, 235)',
backgroundColor: 'rgb(54, 162, 235)',
borderWidth: 2,
borderRadius: 5,
borderSkipped: false,
order: 1
},
{
label: 'Avg',
data: [],
borderColor: 'rgb(255, 205, 86)',
backgroundColor: 'rgb(255, 205, 86)',
type: 'line',
order: 0
}]
};
const pageperfhomechartconfig = {
type: 'bar',
data: pageperfhomechartdata,
options: {
responsive: true,
plugins: {
legend: {
display: false,
},
title: {
display: false,
text: 'Home Page Performance'
}
}
}
};
var pageperfhomeChart = new Chart(
document.getElementById('wpageperfh'),
pageperfhomechartconfig
);
const pageperfproductchartdata = {
labels: [],
datasets: [
{
label: 'Max-Min',
data: [],
borderColor: 'rgb(255, 205, 86)',
backgroundColor: 'lightgreen',
borderWidth: 2,
borderRadius: 5,
borderSkipped: false,
order: 1
},
{
label: 'Avg',
data: [],
borderColor: 'rgb(54, 162, 235)',
backgroundColor: 'rgb(54, 162, 235)',
type: 'line',
order: 0
}]
};
const pageperfproductchartconfig = {
type: 'bar',
data: pageperfproductchartdata,
options: {
responsive: true,
plugins: {
legend: {
display: false,
},
title: {
display: false,
text: 'Product Page Performance'
}
}
}
};
var pageperfproductChart = new Chart(
document.getElementById('wpageperfp'),
pageperfproductchartconfig
);
var conversionchartdata= {
axis: 'y',
labels: [],
datasets: [{
label: 'Value',
data: [],
borderColor: 'rgb(54, 162, 235)',
backgroundColor: 'rgb(54, 162, 235)',
borderWidth: 2,
borderRadius: 5,
borderSkipped: false,
order: 1
}]
};
var conversionchartconfig = {
type: 'bar',
data: conversionchartdata,
options: {
indexAxis: 'y',
responsive: true,
plugins: {
legend: {
display: false,
}
}
}
};
var conversionChart = new Chart(
document.getElementById('wconversions'),
conversionchartconfig
);
$(document).ready(function () {
var chartData = @Html.Raw(Json.Serialize(Model.chartdata));
console.log(chartData);
var pageviews=0;
var lastpv=0;
var pageviewdiff=0;
var pageviewchange="";
var totalorders=0;
var totalsales=0;
if (!isNaN(chartData.pageViews.pv)){
pageviews=chartData.pageViews.pv;
if (!isNaN(chartData.pageViews.prev_pv)){
lastpv=chartData.pageViews.prev_pv;
var diff=0;
if(chartData.pageViews.prev_pv>chartData.pageViews.pv){
diff=chartData.pageViews.prev_pv-chartData.pageViews.pv;
pageviewchange="-"
}else{
diff=chartData.pageViews.pv-chartData.pageViews.prev_pv;
pageviewchange="+";
}
pageviewdiff=percentage(diff,pageviews);
}
}
if (!isNaN(chartData.orders)){
totalorders =chartData.orders
}
if (!isNaN(chartData.orderValue)){
totalsales =chartData.orderValue
}
var context={
pageview: {
title:"Page Views",
views: shortnumber(pageviews),
last:shortnumber(lastpv),
change: pageviewchange,
diff:pageviewdiff
},
totalorders: {
title:"Transactions",
orders: shortnumber(totalorders)
},
totalordervalue: {
title:"Total Sales",
orderValue: shortnumber(totalsales)
},
};
document.getElementById("wpageviews").innerHTML = pageviewTemplate(context);
document.getElementById("wtotalorders").innerHTML =totalordersTemplate(context);
document.getElementById("wordervalue").innerHTML=totalsalesTemplate(context);
const updatedorderbypaychart = Chart.getChart("wordbypaymeth");
updatedorderbypaychart.data.labels=chartData.ordersByPaymentMethod.map((item) =>item.paymentMethod);
updatedorderbypaychart.data.datasets[0].data=chartData.ordersByPaymentMethod.map((item)=>item.orders);
updatedorderbypaychart.update();
const updatedpageperfhomechart = Chart.getChart("wpageperfh");
updatedpageperfhomechart.data.labels=chartData.pagePerformanceHome.time;
updatedpageperfhomechart.data.datasets[0].data=chartData.pagePerformanceHome.maxmin;
updatedpageperfhomechart.data.datasets[1].data=chartData.pagePerformanceHome.avg;
updatedpageperfhomechart.update();
const updatedpageperfproductchart = Chart.getChart("wpageperfp");
updatedpageperfproductchart.data.labels=chartData.pagePerformanceProduct.time;
updatedpageperfproductchart.data.datasets[0].data=chartData.pagePerformanceProduct.maxmin;
updatedpageperfproductchart.data.datasets[1].data=chartData.pagePerformanceProduct.avg;
updatedpageperfproductchart.update();
var funneldata =chartData.conversions.funnelItems.sort(function (a, b) {
return a.order - b.order;
});
var funneldataVal=funneldata.map((item)=>item.value);
const updatedconversionschart = Chart.getChart("wconversions");
updatedconversionschart.data.labels=funneldata.map((item) =>item.item);
updatedconversionschart.data.datasets[0].data=funneldata.map((item)=>item.value);
updatedconversionschart.update();
document.getElementById("wconversionrate").innerHTML = percentage(funneldataVal[funneldataVal.length-1],funneldataVal[0]) + "%";
});
</script>
</body>
</html>
And the result is

RedMetrixWebApp also contains a docker file which should help in running the application easily.
Final notes
RedisTimeSeries : https://redis.io/docs/stack/timeseries/
RedisTimeSeries Commands : https://redis.io/commands/?group=timeseries
NRedisTimeSeries - .Net Client for RedisTimeSeries : https://github.com/RedisTimeSeries/NRedisTimeSeries/
Redis Cloud : https://redis.com/try-free/
Mockaroo - For mock data : https://www.mockaroo.com/7d448f50
RedisProvider : https://github.com/redis-developer/nredi2read-preview/blob/main/Providers/RedisProvider.cs
gridstack.js - For Dashboard Structure : https://github.com/gridstack/gridstack.js
handlebars.js - For widget design : https://github.com/handlebars-lang/handlebars.js
Chart.js - Charting library : https://github.com/chartjs/Chart.js
Github Code Repository - Redmetrix : https://github.com/c-arnab/Redmetrix


Oldest comments (0)