It’s now more than 30 years since the first website was born. Its purpose, you ask? To provide information about the World Wide Web, of course.
In the three decades that have elapsed since then, we’ve created around 6 billion more websites. Some, like that inaugural site about the internet itself, are devoted to providing information. Others allow us to buy and sell products. Others give us access to photos, videos and other forms of media. And then there are those which allow us to come together and interact, rating one another’s content and creating a self-sustaining community.
But what all websites have in common is that they enable users to complete a specific, pre-determined action. Back when websites first started out, it could take a user minutes, even hours to complete their desired action. But nowadays, the evolution of broadband and digital design standards mean they can achieve them in just a few seconds. And when a site makes them wait, they’re likely to abandon it for good (and provide negative feedback to their friends, too).
So it’s crucial that we continue to monitor our site’s performance, paying attention to both the speed and the wider user experience. In this article, we will learn about techniques to measure this performance, as well as diving into the details of how to find bottlenecks and plan fixes using the tools provided with the Google Chrome Browser.
Meet Lighthouse
Lighthouse is an open-source tool for improving website quality, including performance. You can use it from the Chrome DevTools, command line, as a Node module, or from a web UI. In this article, we will see examples of running it from the Chrome DevTools.
With the latest Chrome browser(version 87), Lighthouse comes as a separate panel in the DevTools. You will find options to audit Performance, Accessibility, SEO, Best Practices, etc., and generate reports inside the Lighthouse panel.
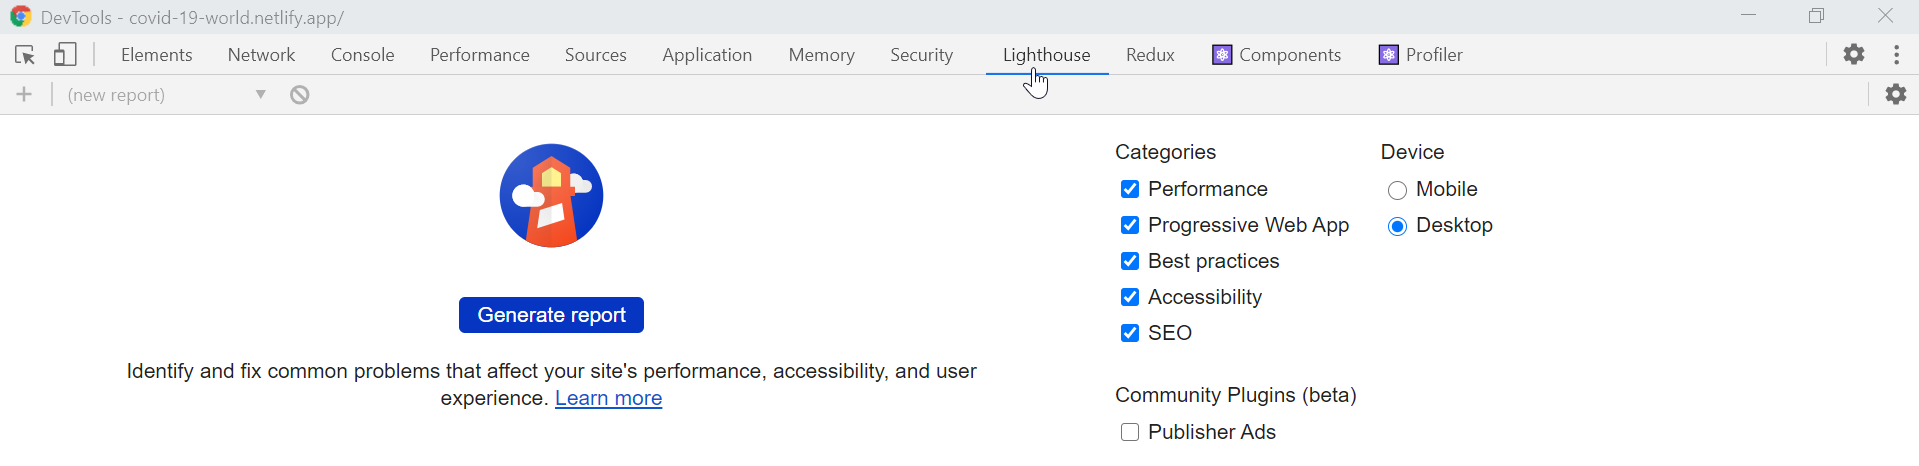
Let us try running a Performance report on a website. We will use a website https://covid-19-world.netlify.app/ to run this report. You can follow the steps below to run it on any website you like.
The website https://covid-19-world.netlify.app/ shows charts, graphs, and visualization about ongoing COVID-19 data. It makes API calls to retrieve the information, and we may see some opportunities to improve the website’s performance.
- Launch a browser tab in incognito mode. You can press the key combination Ctrl + Shift + N to open the browser in incognito mode.
- Browse to the website by typing the URL in the address bar.
- Press the F12 key to open the DevTools. Navigate to the ‘Lighthouse’ tab.
- Check the ‘Performance’ category and click the ‘Generate report’ button.
Lighthouse will start the action to begin measuring the website’s performance. It may take up to 45 to 60 seconds to generate the performance report. Once complete, you should see a report generated like this,

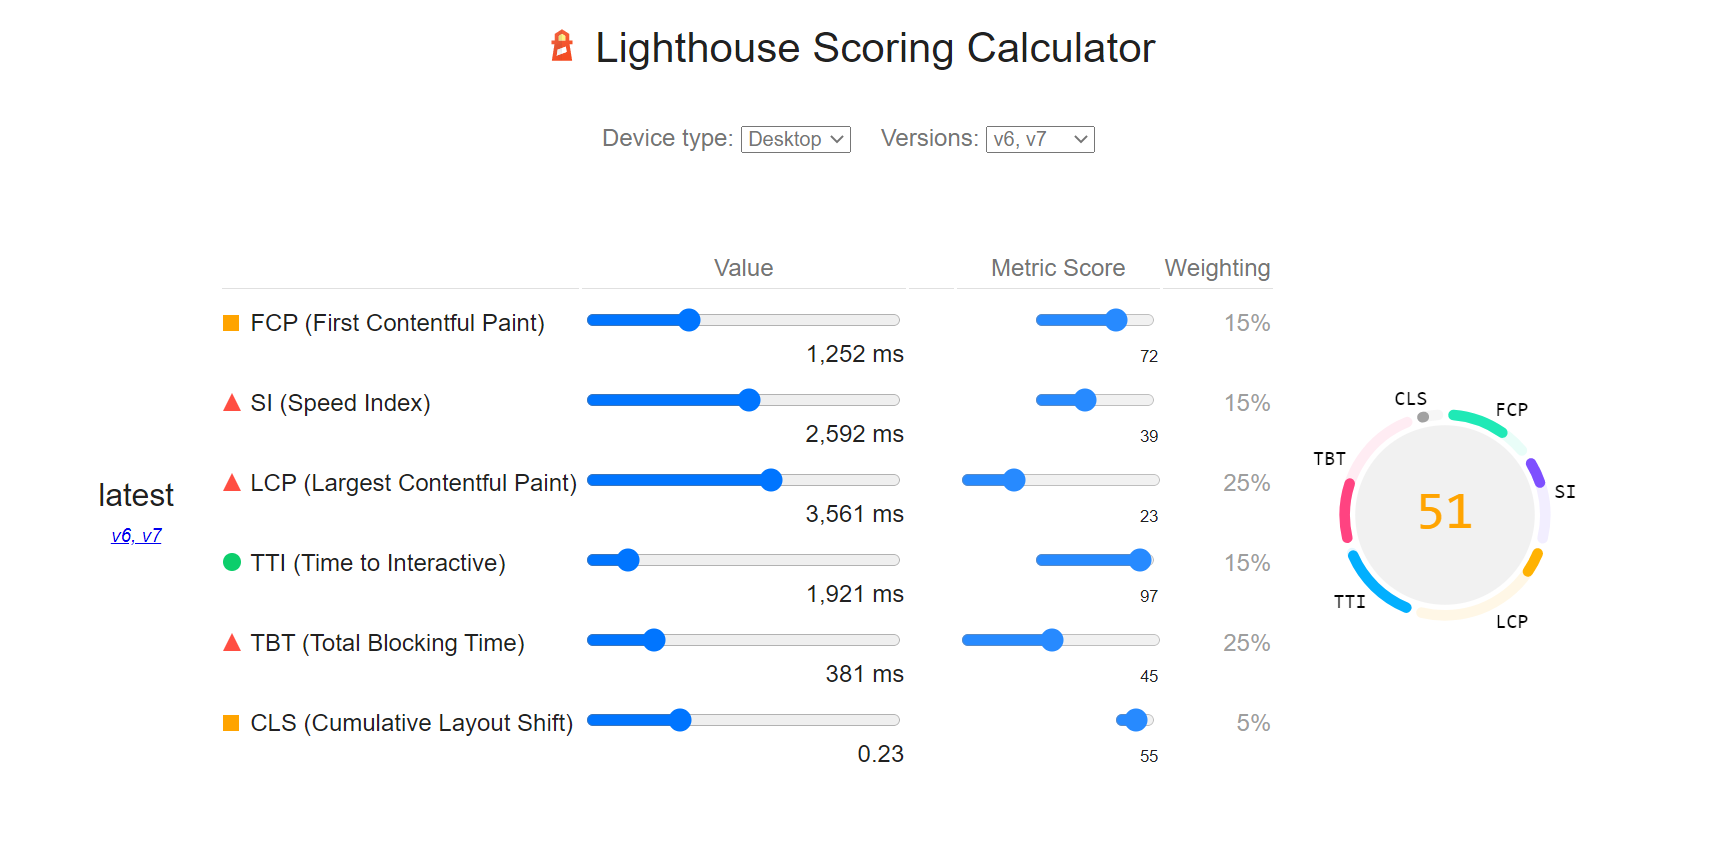
We see the number ’51’ at the top, which is our score (by the way, that’s not great!) and the metrics’ details and performance values. The same report also captures how to improve some of the scores and diagnostics. In fact, we will see some of these soon.
Performance Metrics
The performance score is derived from six key metrics, which are:
- First Contentful Paint (FCP): When the first text or the image paint is complete.
- Speed Index (SI): How quickly the content of the page is visible.
- Largest Contentful Paint (LCP): When the largest image or text paint is complete.
- Time to Interactive (TTI): Total time for the page to become fully interactive.
- Total Blocking Time (TBT): Time spent between the page being fully interactive (TTI) and the first text/image pain (FCP).
- Cumulative Layout Shift (CLS): Shift/movement of the visible elements within the viewport.
The overall performance score is a weighted average of the metric scores. As you’ll see in the image below, the score ’51’ is a calculation based on all the metrics.
You can find in-depth information about the Lighthouse performance scoring system here.
How to use Performance Audit Results?
We should use the performance audit result to improve the website performance further. If your website’s overall performance score is below 90, you have ample room for improvement! The performance report also suggests opportunities and diagnostics that may improve the performance score.
Opportunities
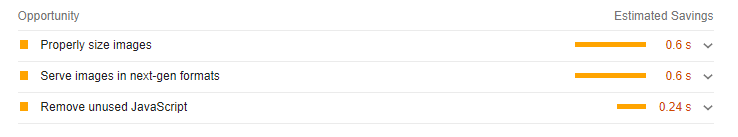
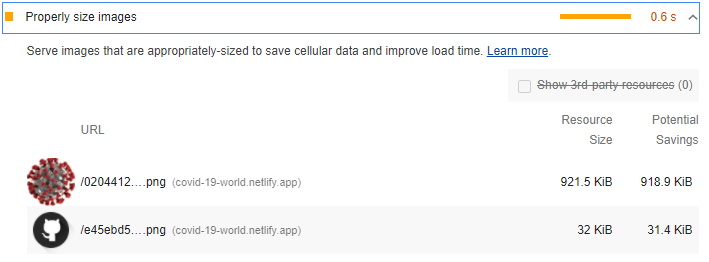
Through the various audits it runs, Lighthouse can help you understand the factors that can improve your performance. For example, the image below shows how you can improve performance using correctly sized images, next-gen image size, and removing unused JavaScript from the code.
We can drill down into any of the opportunities to know more about it. Let’s drill down to the opportunity “Remove unused JavaScript.”
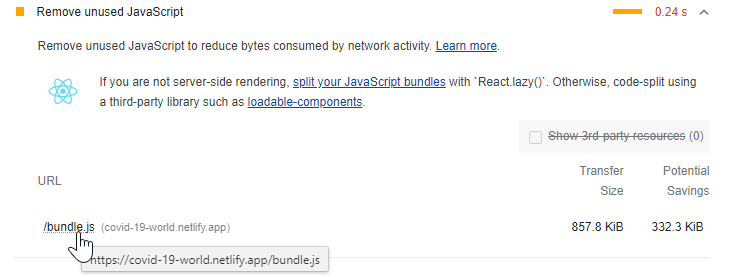
We now see the opportunity to save more than 300KBS in data transfer. We can use the code-splitting technique by using React.lazy() or any other alternatives. Similarly, we can make improvements in reducing the image sizes.
Diagnostics
Diagnostics offer more information about the performance of your application. Looking into these diagnostics will enable you to understand why specific metrics scores have changed. Please take a quick look at the list of diagnostics we get for our website; the ones in red and orange colors require attention.
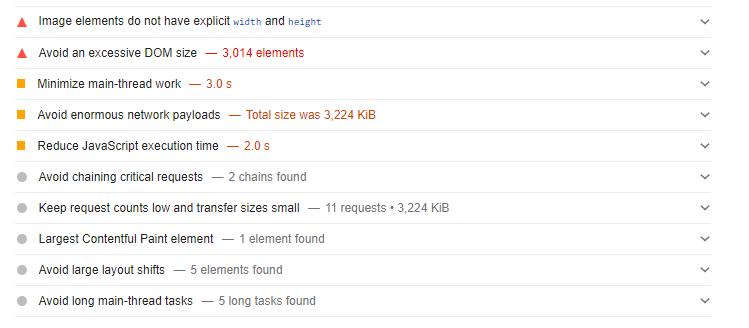
Now let’s take 2-3 diagnostics from the above list and understand what we can do to perform better.
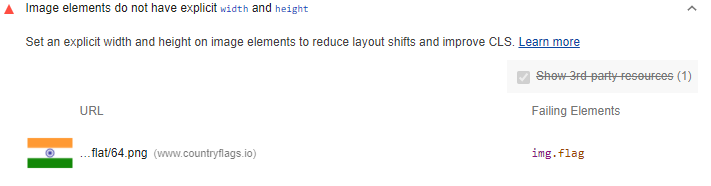
Image element explicit width and height
It’s good practice to set a specific width and height to images to improve CLS. In the image below, we can see what happens when we don’t do this.
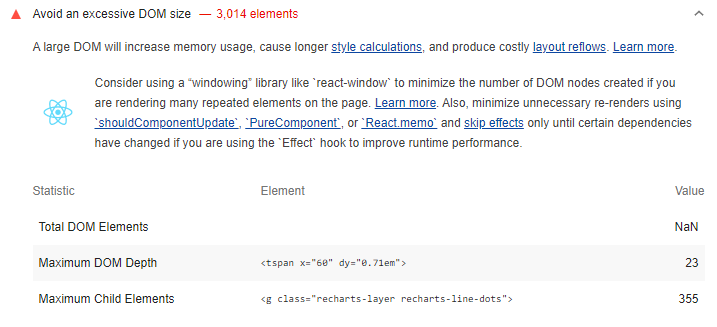
Avoid excessive DOM size
A library like Reactjs helps us in building components with the re-usable code unit. The state variables should drive the render() method in a component, and they also help in several optimizations. We need to make sure there are not too many re-renders, as these can cause performance degradation.
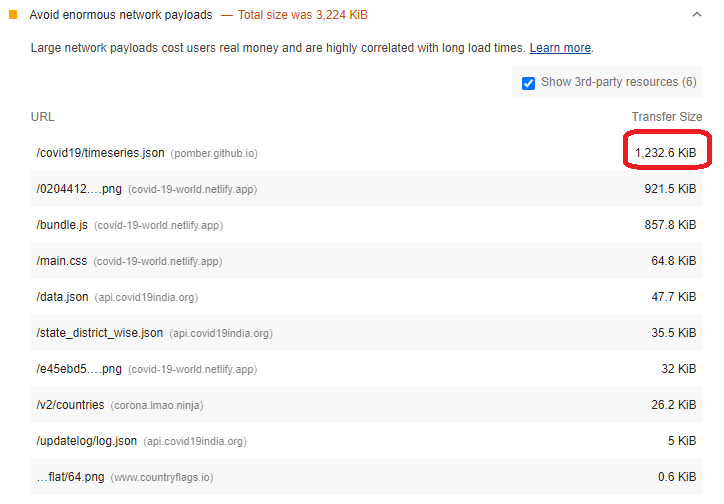
Avoid enormous network payload
Any network payloads of more than a few kilobytes are going to hurt the performance of a website, as you can see in the image below. A network payload to retrieve a JSON response is more than an megabyte in size, and forces the respective UI to wait until the payload is received.
Several other types of diagnostics are possible using Lighthouse performance audit. It may vary from application to application.
Chrome Devtools – The Performance Tab
The Lighthouse tool also provides a mechanism to perform various advanced inspections on the performance factors. You can debug the original trace to know the internals. To do that, please click on the View Original Trace button.

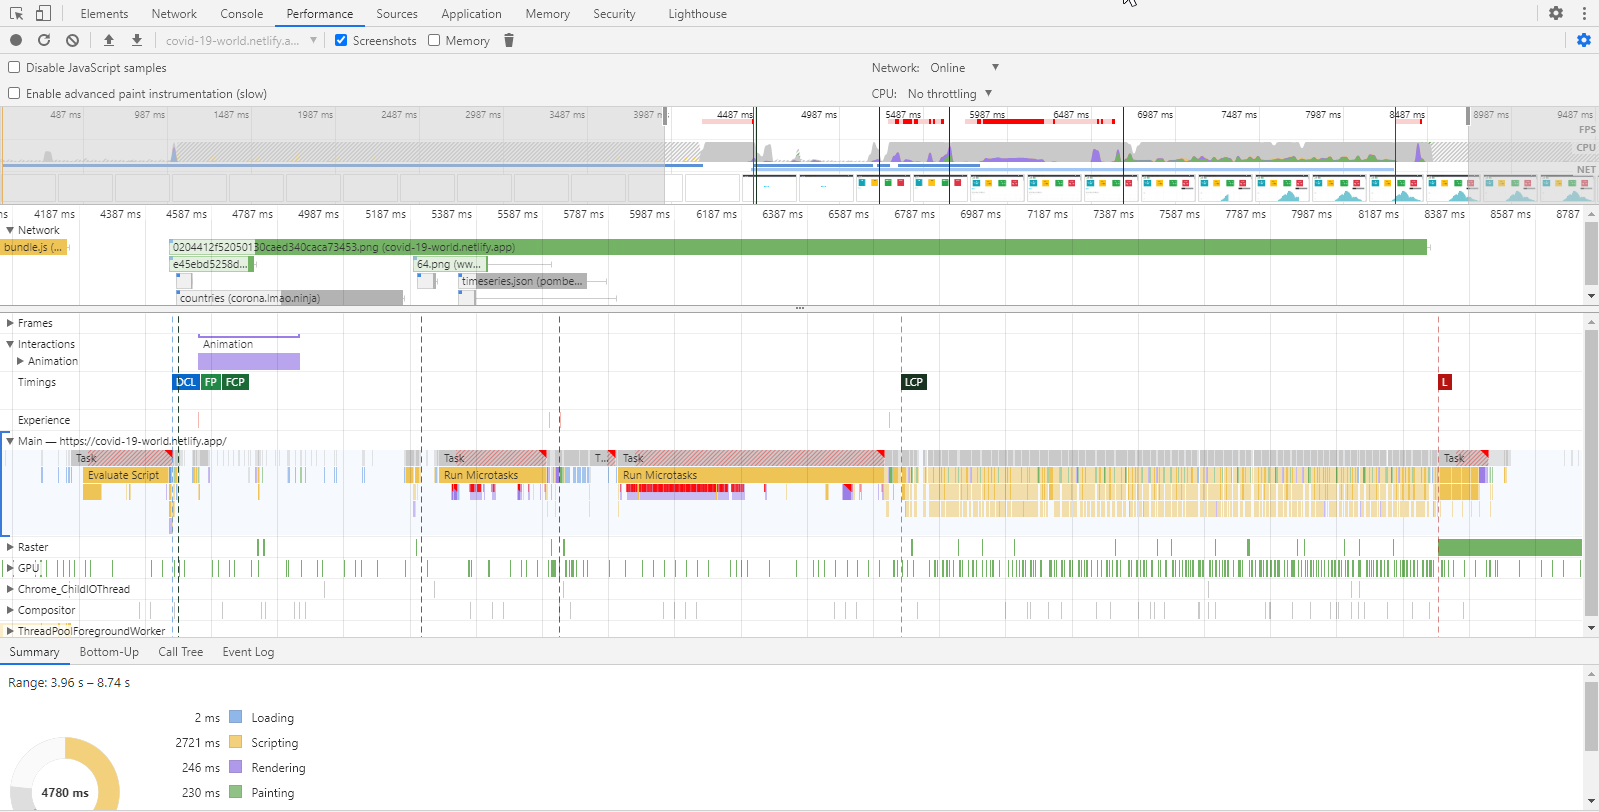
You will see the Performance tab opens up with lots of data and visualization in it.
Please note, you can directly open this tab and record the performance trace manually. To start the recording, click on the record button(the gray circle at the top-left) and begin performing an operation on the page.
The sheer volume performance trace data can be overwhelming to begin with, so it’s better to start with the Lighthouse tool and then come for the trace inspection as required. Let’s take a tour of some of the trace results sections and infer the details further.
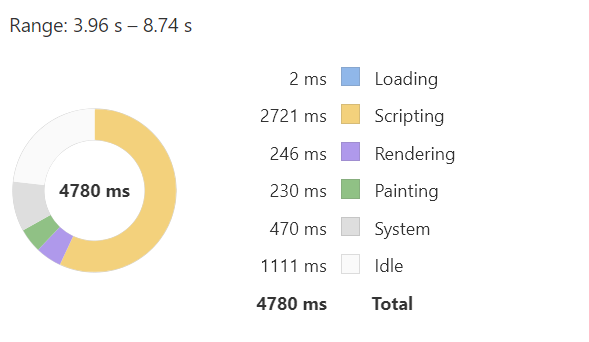
The bottom-most panel is called the summary panel, and shows the time break-up of each of the actions responsible for the page to be fully interactive. See the image below. You’ll see that the ‘scripting’ and ‘idle’ states are consumed most of the time.
We can infer two things from here:
- We are probably downloading a massive payload over the network in the beginning, and it may be this that causes the initial idle time to be so long.
- We have opportunities to make some improvements in the scripting area to make the performance better. We may want to check if we are performing Tree Shaking correctly, or we may need a code-splitting technique, or it could be some loops, logic, etc.
If you recall, we have seen some of these as diagnostics and opportunities already!
Next, we will look into the Network section. You can see the request has taken a long time to serve a response, show response data size, and provide anything to optimize.

The main trace section will mark the places where it finds a performance degradation. You can mouse over the red areas to get more details about it.
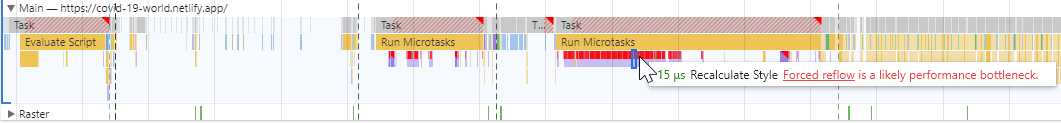
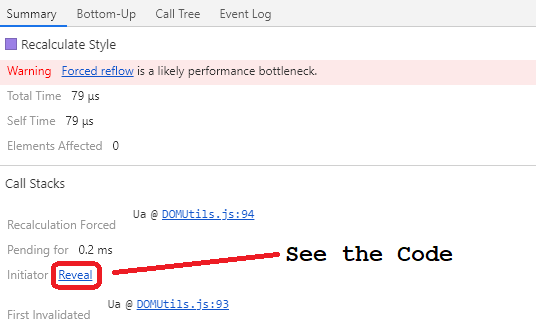
A click on any of the concerning areas would show more information in the bottom panel. You can read the call stacks and drill down to the source code section that may be causing the performance issue.
After we address the issues identified using the Lighthouse and the performance trace, we should rerun the audit to see the performance improvement.
In Summary
Ok, here’s a quick summary of what we’ve learned:
- A website with good performance is the key to user experience and retention.
- You need tools to inspect, assess, benchmark, and improve the performance of your website.
- Lighthouse is an open-source tool available in several forms to audit the performance of the website.
- Understand the performance metrics and assess what the vitals for your website are. It would help if you focused on improving the scores for those.
- It is better to start with the Lighthouse tool and look into the opportunities, diagnostics, and traces.
- Performance improvement is not an overnight thing. It has to be planned well and may require several phases.
Where to go from here?
I hope this article gives you a good start and awareness of the available performance tools. I’ll leave you with a few more reads & videos to catch up on for more in-depth knowledge about performance tuning and debugging.


Top comments (1)
Why is this article so under appreciated! Have been working on these performance metrics myself lately. Curating Landing Page performance score from 5 to 100. This is a good article for someone to start with.